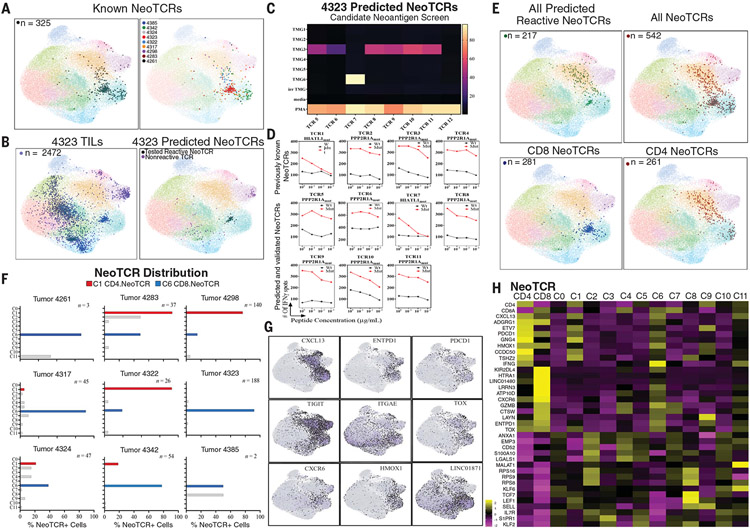
Fig. 2. Neoantigen-reactive CD4 and CD8 T cells exist in common dysfunctional states.
(A) UMAP of all archival T cells overlaid with known neoantigen-reactive T cells from all patients (left; n = 325) and individually by patient (right; see also table S7). (B) (Left) Projection of all T cells from tumor 4323 (n = 2472) onto a transcriptomic map of T cells from all patients. (Right) Projection of newly predicted, experimentally tested neoantigen-reactive TCR-bearing cells from tumor 4323 (tested reactive NeoTCR, black; n = 53) and cells bearing TCRs that were negative in our screening assay (nonreactive TCRs, purple; n = 76). (C) Heatmap of TCR screening of predicted NeoTCRs from tumor 4323, showing reactivity of seven of eight TCRs to tandem minigenes 3 or 6 (TMG3 or TMG6). The right axis, which shows the percentage of activated T cells, indicates those expressing 4-1BB, as determined by flow cytometry. irr TMG, irrelevant TMG (i.e., TMG expressing candidate neoantigens not present in tumor 4323); PMA, phorbol 12-myristate 13-acetate and ionomycin. (D) Peptide titration curves of TMG-reactive TCRs from tumor 4323, as measured by interferon-γ (IFNγ) ELISpot. (Top row) TCRs 1 to 4 were previously known to be reactive to either HIATL1mut (p.G380V) or PPP2R1Amut (p.L432S). (Bottom rows) Newly identified TCRs showing selectivity for the same neoantigens over the corresponding wild-type peptides. Wt, wild type; Mut, mutant. (E) (Top left) Projection of newly identified NeoTCR-expressing cells (n = 217) onto a transcriptomic map from all samples. (Top right) Projection of all known NeoTCRs, including previously known NeoTCRs [from (A)] and newly identified NeoTCR clones (n = 542). (Bottom left) Projection of all known CD8-restricted NeoTCRs, showing high abundance in C6 (n = 281). (Bottom right) Projection of all known CD4-restricted NeoTCRs, showing high abundance in C1 (n = 261). (F) Bar graphs showing distribution of all known NeoTCR-expressing cells across clusters by patient. Gray bars indicate T cell clones seen outside of NeoTCR clusters C1 and C6. (G) Gene expression of representative highly expressed genes from NeoTCR-expressing cells relative to other cells, projected onto a transcriptomic map. (H) Heatmap showing gene expression of the most differentially expressed genes from CD4+ NeoTCR-expressing cells (NeoTCR CD4) and CD8+ NeoTCR-expressing cells (NeoTCR CD8) relative to all clusters. A subset of select stemness and memory genes is shown for comparison.

