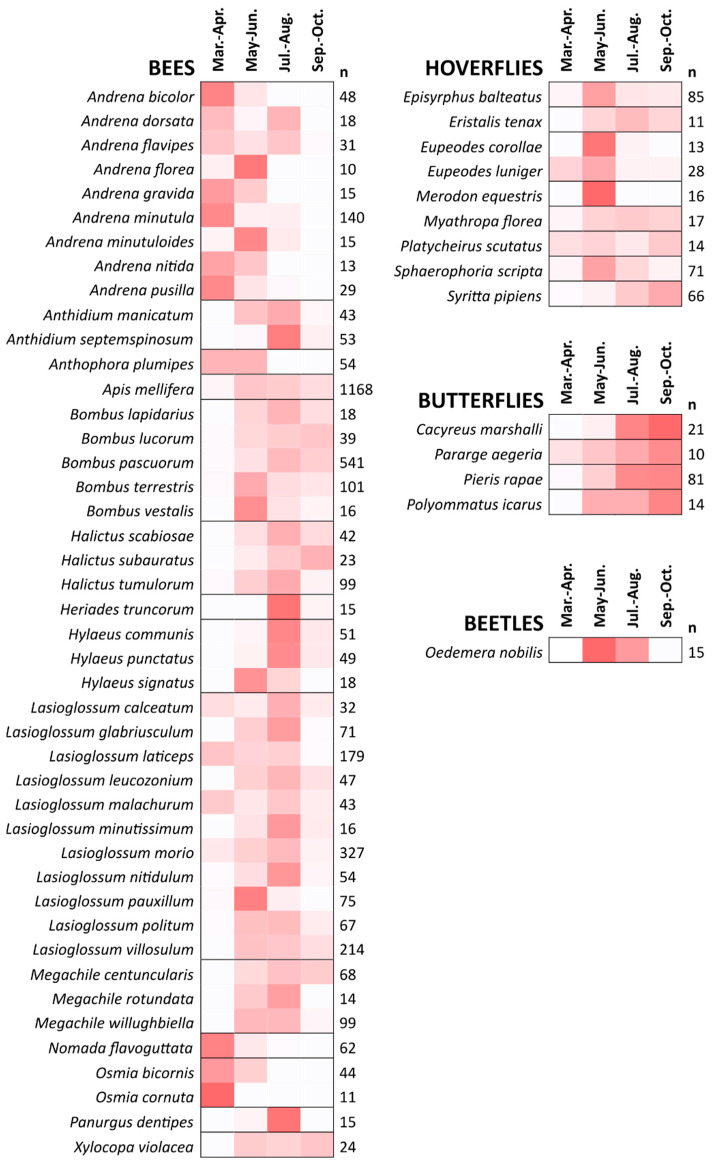
Figure 2.
Seasonal distribution of insect occurrence in all twelve green spaces and both years combined. The color intensity gradient represents the distribution of catches for each species over the study period, which is divided into two-month intervals (redder means more catches). Only bee, hoverfly, butterfly, and beetle species collected in large numbers are represented (total number of individuals per species n ≥ 10).

