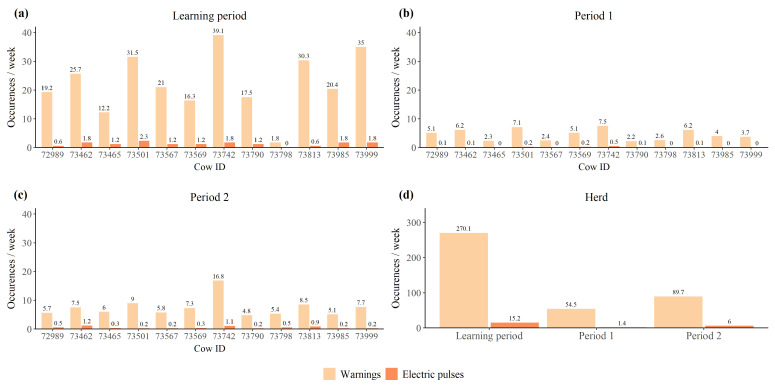
Figure A10.
Average number of auditory warnings and electric impulses received per week by (a) each individual in the learning period, (b) each individual in period 1, (c) each individual in period 2, and (d) the entire herd during each of the three periods. Excluding days where a social panic reaction occurred.

