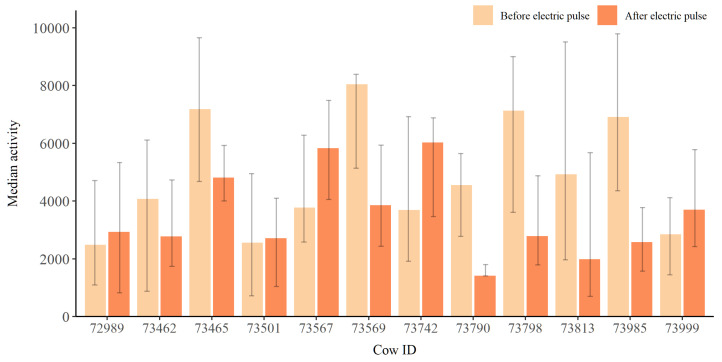
Figure A12.
Median activity of each individual two hours before and after receiving an electric impulse (). Error bars represent the interquartile range. An asterisk next to the serial number denotes statistical significance (p < 0.05). Excluding data from days where a social panic reaction occurred.

