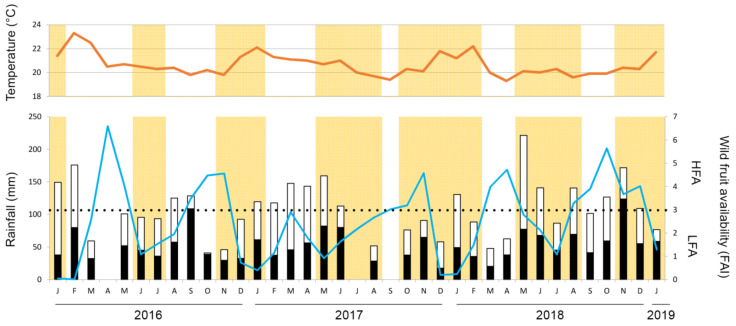
Figure 2.
Maize calendar, wild fruit availability, rainfall, and mean temperature between January 2016 and January 2019. The red line represents the mean monthly temperature, and the blue line is the total monthly rainfall (mm). Months with a yellow background correspond to months with edible maize at the PNK edges. Black and white bars represent the monthly wild ripe and unripe fruit availability (FAI), respectively. FAI data were missing for April 2016, as well as July and September 2017. Dotted line represents the limit between low (LFA) and high wild fruit availability (HFA).

