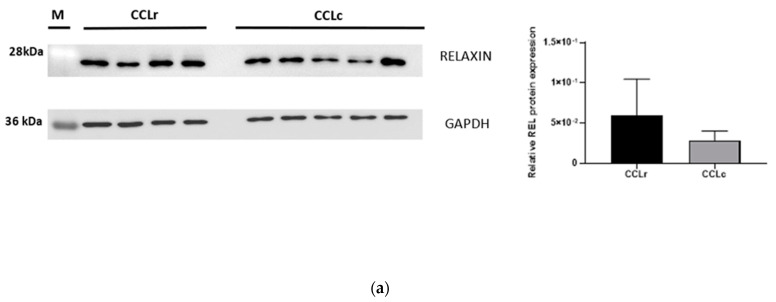
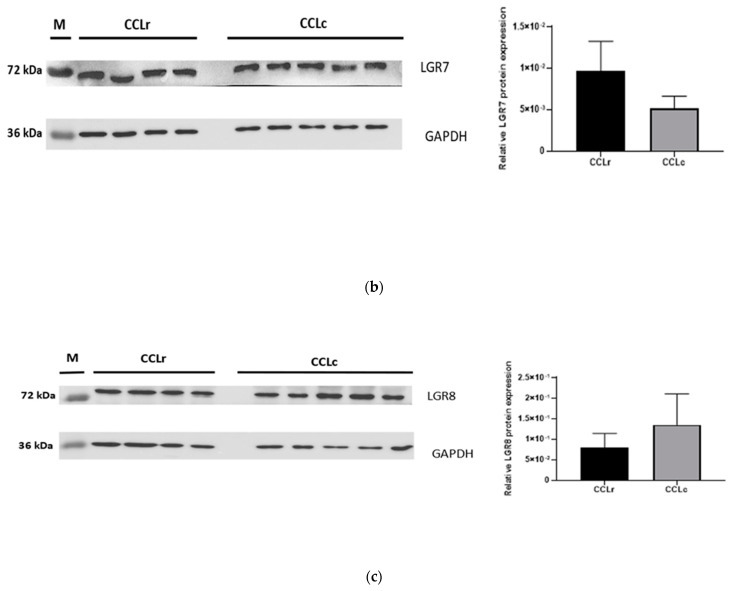
Figure 6.
Western blot analysis of relaxin (a), LGR7 (b), and LGR8 (c) protein expression in four CCLr tissue samples and in five CCLc tissues. The bar graphics show the mean ± SEM of relative relaxin, LGR7, and LGR8 protein expression in the CCLr and CCLc samples. Plots show densitometric analysis of relaxin, LGR7, and LGR8 protein bands expressed as relaxin, LGR7, or LGR8/GAPDH densitometry ratio for each tissue sample. Note that GAPDH was identical solo for relaxin and LGR7; for LGR8, the same GAPDH was applied but on a different membrane. M = molecular weight marker.


