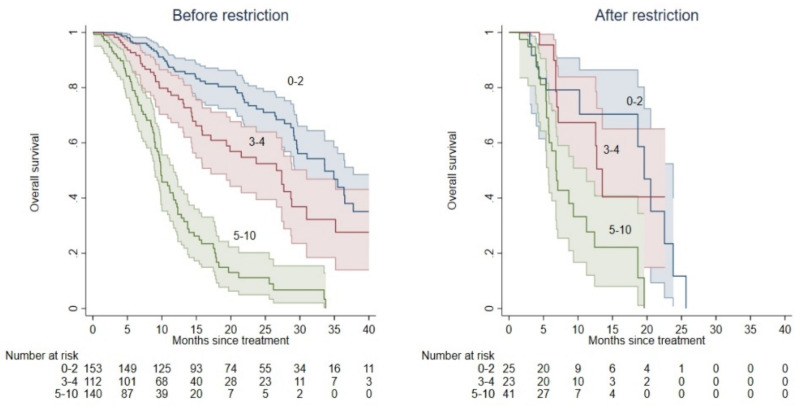
Figure 2.
Kaplan-Meier OS curves according to the BIO-Ra risk classes before and after the EMA restriction of the use of Ra-223. OS prediction according to the BIO-Ra score, categorizing patients into three prognostic groups before (left Panel) and after (right Panel) the EMA restriction of the use of Ra-223. BIO-Ra scores 0–2, 3–4, and 5–10 corresponding to low-, intermediate-, and high-risk classes are represented as blue, red, and green colours, respectively.

