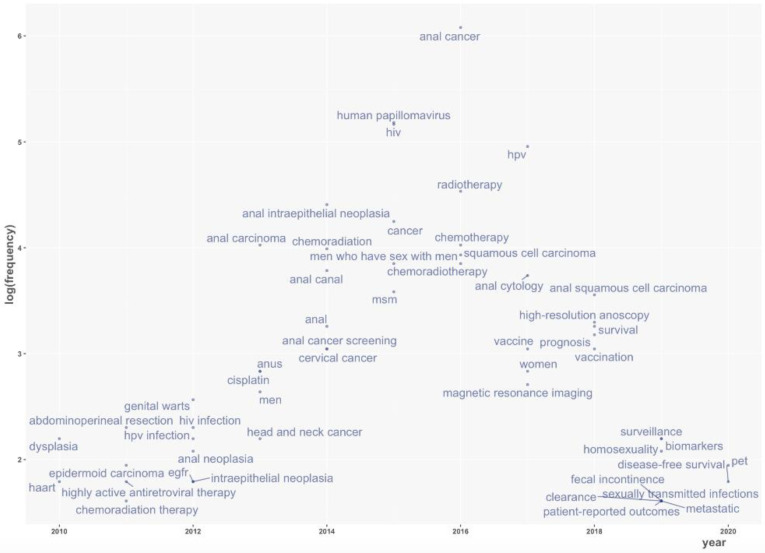
Figure 4.
Trend topics in the last 10 years. The graph represents the use of the most frequent keywords over time; the respective frequency (for the specific year) is displayed on a vertical axis in a logarithmic scale. Each keyword is marked on the year with its highest prevalence in the literature.

