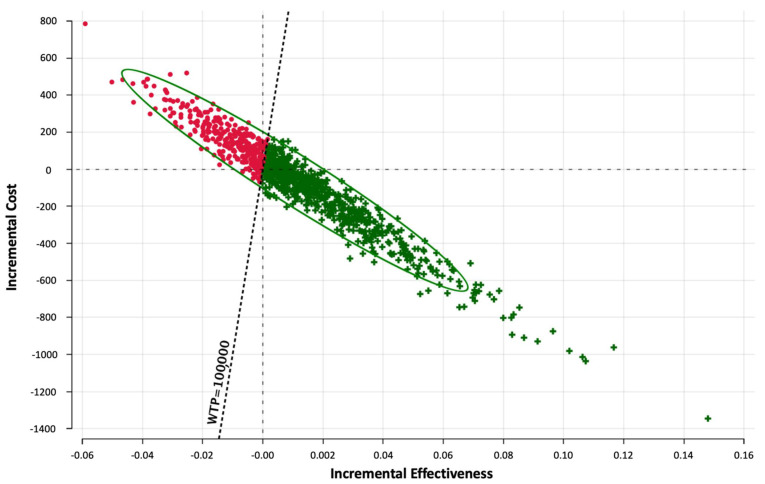
Figure 3.
Probabilistic sensitivity analysis utilizing Monte-Carlo simulations (30,000 iterations). Incremental cost-effectiveness scatter plot for CT + AI vs. CT. iterations with an ICER-value below the willingness-to-pay of USD 100,000 per QALY are shown as green crosses. WTP = willingness-to-pay.

