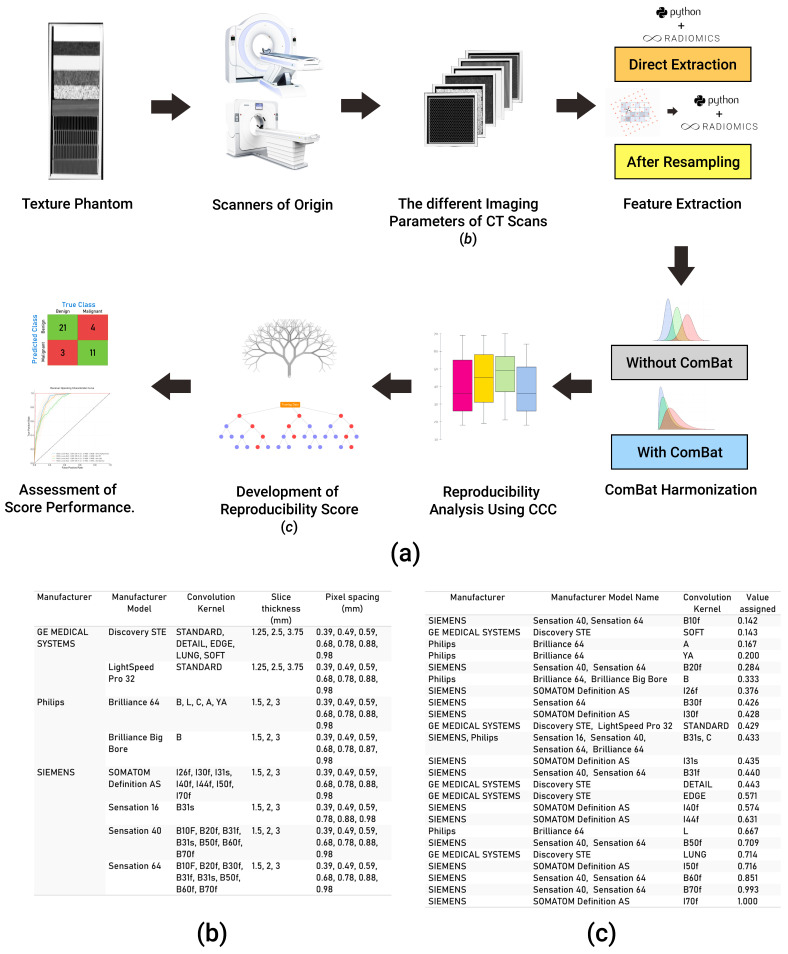
Figure 1.
Explanatory diagram of our workflow. (a) The steps undertaken for data collection, analysis, and the development of the score; (b) a table showing different acquisition and reconstruction parameters of the phantom dataset; (c) a table showing the numeric value assigned to each kernel in the data analyzed.

