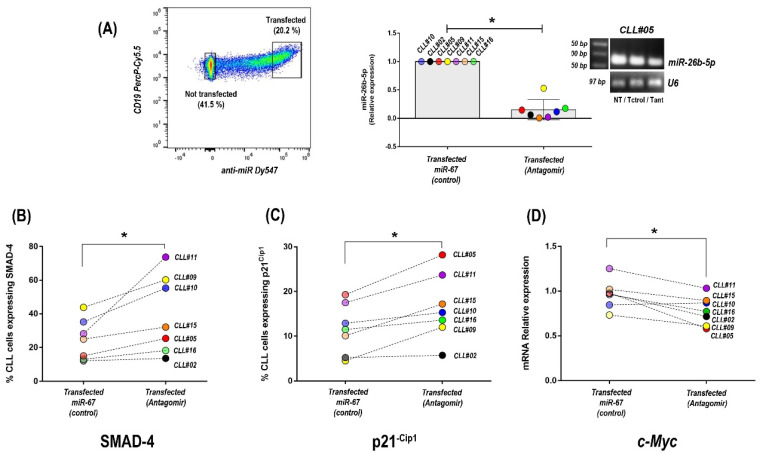
Figure 4.
Inhibition of miR-26b-5p and evaluation of SMAD-4, p21−Cip1, and c-MYC expression changes in primary CLL cells of progressive U-CLL patients. (A) Representative dot plots showing transfected CLL cells with specific antagomir targeting miR-26b-5p labeled with Dy547 (left panel). Graph shows relative expression levels of mir-26b-5p in CLL cells after transfection with the specific antagomir and the irrelevant miR-67 control (p = 0.015, signed-rank test, n = 7). Agarose gel 5% stained with Ethidium Bromide shows a representative patient after transfection with the specific antagomir (Tant) and the corresponding controls (not transfected—NT—and transfected with the irrelevant miR-67, Tctrol) (right panel). (B–D) Percentages of cells expressing Smad-4 (B), p21−Cip1 (C), and mRNA levels expression of c-MYC (D) after transfection with the specific inhibitor of miR-26b-5p and with miR-67 (control) in each patient (p = 0.031, p = 0.015, and p = 0.047, respectively, Wilcoxon signed-rank test, n = 7). Each color corresponds to a single patient. In all cases, p < 0.05 was considered statistically significant, (* = p < 0.05).

