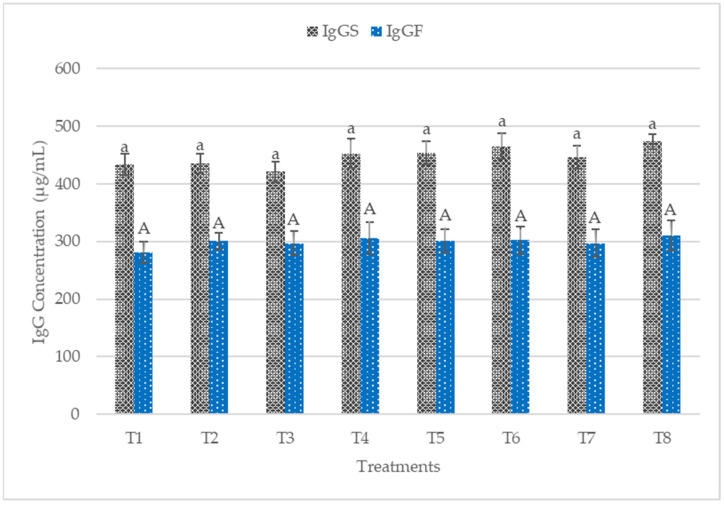
Figure 3.
Plasma immunoglobulin G (IgG) concentrations of starter and finisher broiler chicken fed postbiotics and paraprobiotics. Bars with the same letters were not significantly different (p > 0.05) for both IgG for starter and IgG for finisher, n = 6. T1 = negative control (Basal diet), T2 = positive control (Basal diet + 0.01% (w/w) Oxytetracycline), T3 = Basal diet + 0.2% (v/w) postbiotic TL1, T4 = Basal diet + 0.2% (v/w) postbiotic RS5, T5 = Basal diet + 0.2% (v/w) paraprobiotic RG11, T6 = Basal diet + 0.2% (v/w) postbiotic RI11, T7 = Basal diet + 0.2% (v/w) paraprobiotic RG14, T8 = Basal diet + 0.2% (v/w) paraprobiotic RI11. IgGS = Immunoglobulin M for starter, IgGF = Immunoglobulin M for finisher.

