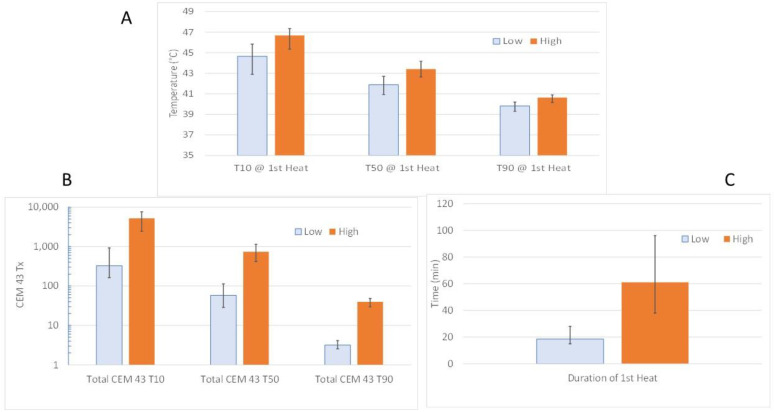
Figure 2.
Thermal dose characteristics of thermal dose escalation trial of Thrall et al. [108] (A) Comparison of CEM43T10, T50 and T90 values. The trial was designed to deliver approximately a 20-fold difference in CEM43T90 between the low and high dose groups. (B) To achieve this difference in CEM43T90, and CEM43T10, T50 throughout the tumors were higher. (C) Heating times were also longer. N = 21 Low dose group; N = 18 High dose group. Data from the subjects for which physiologic data were reported (Lora-Michaels et al. [109]).

