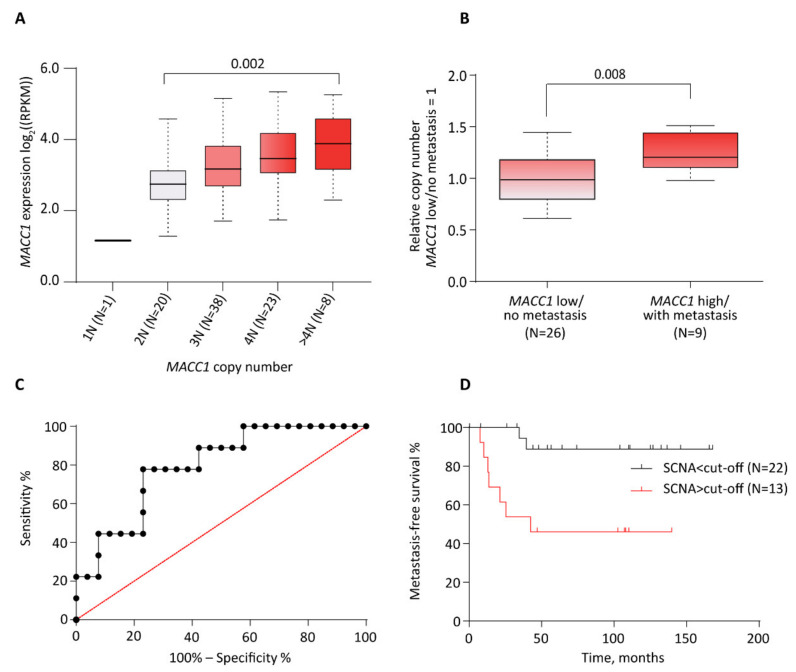
Figure 1.
Overlay of copy number, expression of MACC1, and metastasis in the CRC OncoTrack cohort and Charité metastasis cohort. (A), Box plot shows expression distribution of samples with different copy number estimates for MACC1. The copy numbers are indicated below each box (xN). The number of samples per group is shown in brackets. (B), MACC1 SCNA in patients with and without metastasis. Patients with known metastasis status and MACC1 gene expression level were assessed for MACC1 copy number. Patients with low MACC1 gene expression and no metastasis showed less genomic MACC1 copies compared to patients with unfavorable high MACC1 gene expression and diagnosed metastasis. (C), Receiver operating characteristic (ROC) curve to define the cut-off value for MACC1 gene copy number discriminating patients in groups above and below this threshold. The maximum of the Youden-index (J = Sensitivity + specificity − 100) was used to identify this value. (D), Kaplan-Meier analysis showing CRC patient metastasis-free survival stratified by tumor MACC1 gene copy number (SCNA > cut-off vs. SCNA > cut-off). The median was used as the cut-off point for MACC1 expression.

