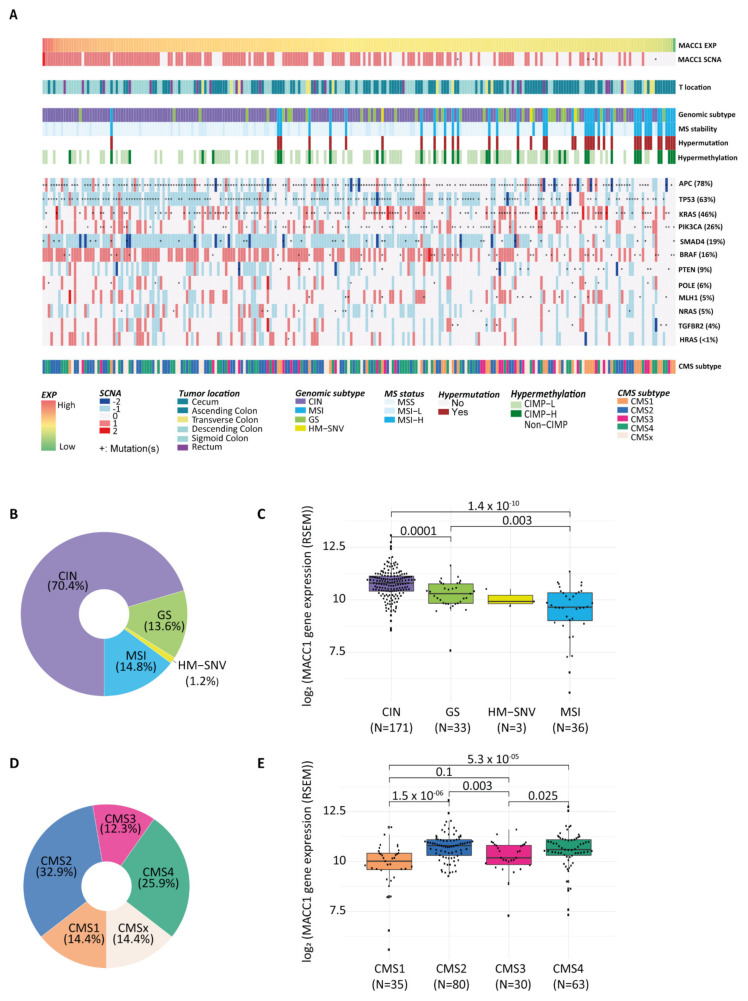
Figure 3.
MACC1 mRNA expression and CRC molecular subtypes. (A), Landscape showing the association of MACC1 SCNA and expression according major colorectal-cancer-associated subtypes including MSI status, genomic subtypes, hypermutation status, hypermethylation, consensus molecular subtypes (CMS), tumor location and genes commonly mutated in CRC. (B), Donut chart representing the percentage distribution of each genomic molecular subtype in the Liu et al. COAD-READ tumor subset. (C), Box plot of MACC1 mRNA expression by tumor molecular subtypes (genomic). HM-SNV was excluded from the analysis due to small sample size. (D), Donut chart showing the percentage of tumors classified according to the consensus molecular subtypes (CMS 1–4), CMSx are mixed or indeterminate. (E), Box plot showing the distribution of the MACC1 mRNA expression in the different CMS tumor subtypes. (C,E), horizontal bars indicate median values, boxes are interquartile range, whiskers indicate values within 1.5 times interquartile range.

