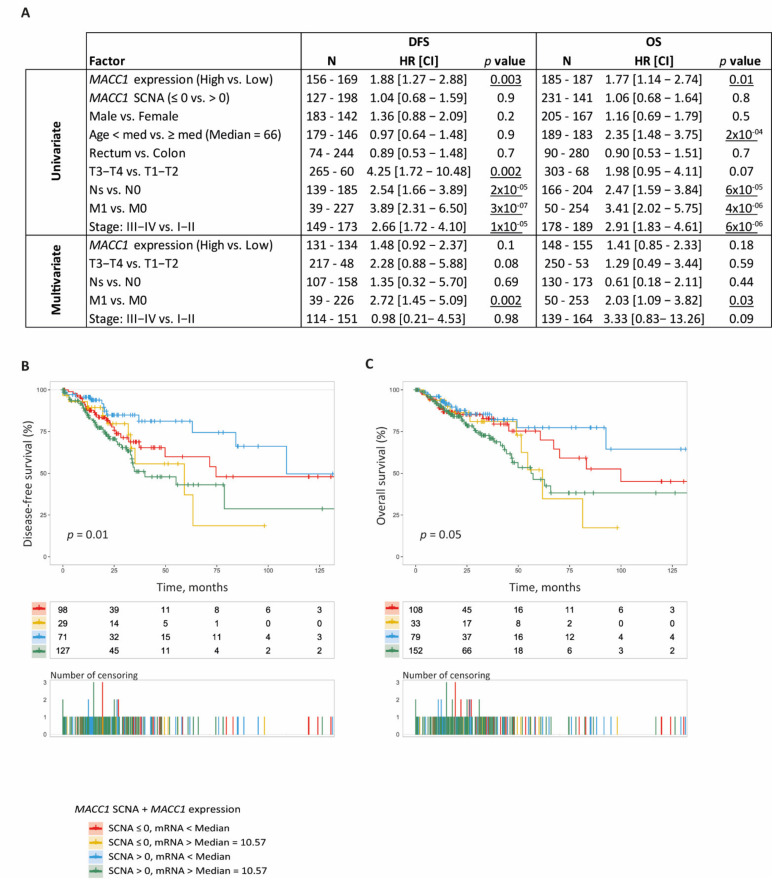
Figure 4.
MACC1 SCNA and expression and CRC patient DFS and OS. (A), Univariate and multivariate Cox analysis (DFS and OS) in COAD-READ TCGA patients (N = 218). HR: Hazard ratio; CI: Confidence interval. N represents the number of cases in each group. Wald test was used to identify the risk factors with patient DFS and OS. Significance setup at p < 0.05. (B,C), Combined Kaplan-Meier analysis of MACC1 status (SCNA and mRNA). (B), DFS according to the MACC1 status, (C), OS according to the MACC1 status.

