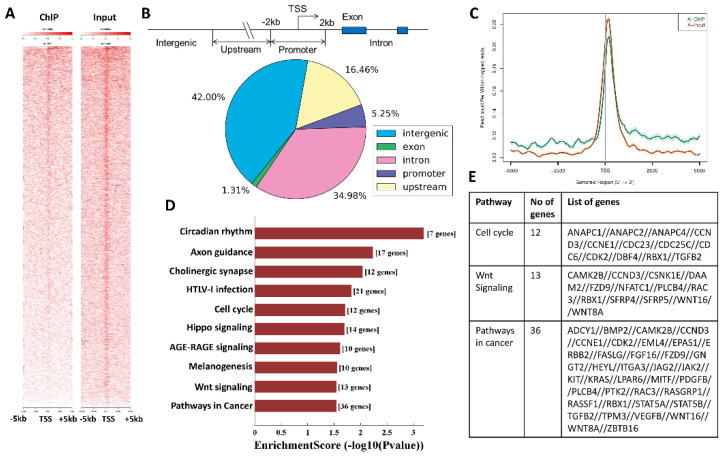
Figure 4.
Chromatin immunoprecipitation (ChIP) analysis of transcriptomic and genome-wide SMYD3 binding profiles in MB. (A) Heat map showing the distribution and peak intensity of SMYD3 genomic occupancy from 5 kb downstream to 5 kb upstream. (B) Schematic representation of peaks into promoter peaks, upstream peaks, intron peaks, exon peaks, and intergenic peaks; pie diagram showing the distribution of peaks. (C) Graph depicting the ChIP peak at the global TSS (green) vs. Input peak (orange). (D) Pathway analysis using the Kyoto Encyclopedia of Genes and Genomes (KEGG) database showing SMYD3 enrichment scores. (E) List of genes and their representative pathways whose promoters were bound by SMYD3, as predicted by KEGG pathway analysis.

