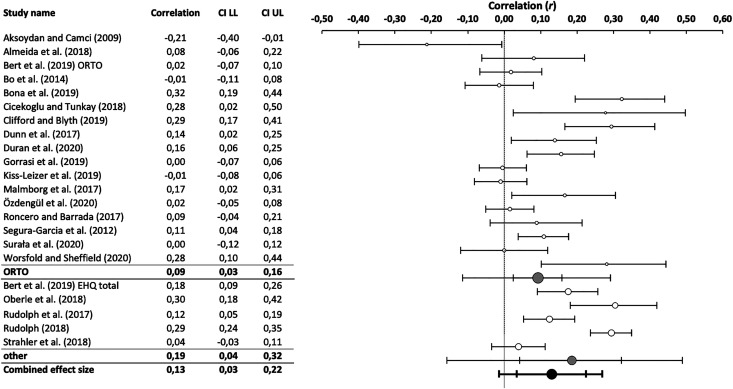
Fig. 2.
Forest plot of all studies examining any exercise measure, grouped by orthorexic eating measure. Effect size is represented as correlation r. Notes: ORTO, studies employed a version of the test for the diagnosis of Orthorexia; other, studies either employed the Duesseldorf Orthorexia Scale or the Eating Habits Questionnaire (EHQ); CI, 95% confidence interval; LL, lower limit, UL, upper limit. Studies are provided in alphabetical order. *Bert et al. (2019) employed both, the ORTO-15 and the EHQ. For the overall effect size, data from this report were combined. In the subgroup analysis, both effect sizes were considered. Studies are provided in alphabetical order.

