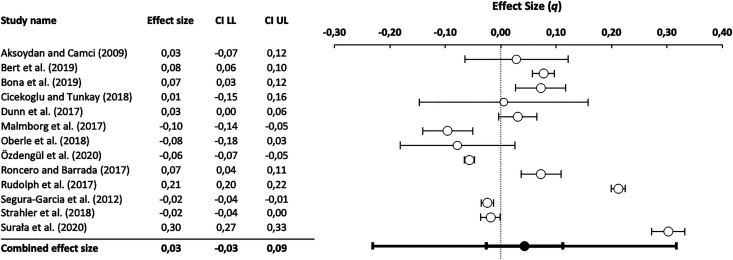
Fig. 3.
Forest plot of all reported gender differences. Effect size is represented as Cohen's q. Note that positive values indicate stronger correlations in the female sample. Notes: CI, 95% confidence interval; LL, lower limit, UL, upper limit. Studies are provided in alphabetical order. Bert et al. (2019) employed both, the ORTO-15 and the Eating Habits Questionnaire (EHQ). For the overall effect size, data from this report were combined. In the subgroup analysis, both effect sizes were considered (ORTO r = 0.02, EHQ r = 0.13). Studies are provided in alphabetical order.

