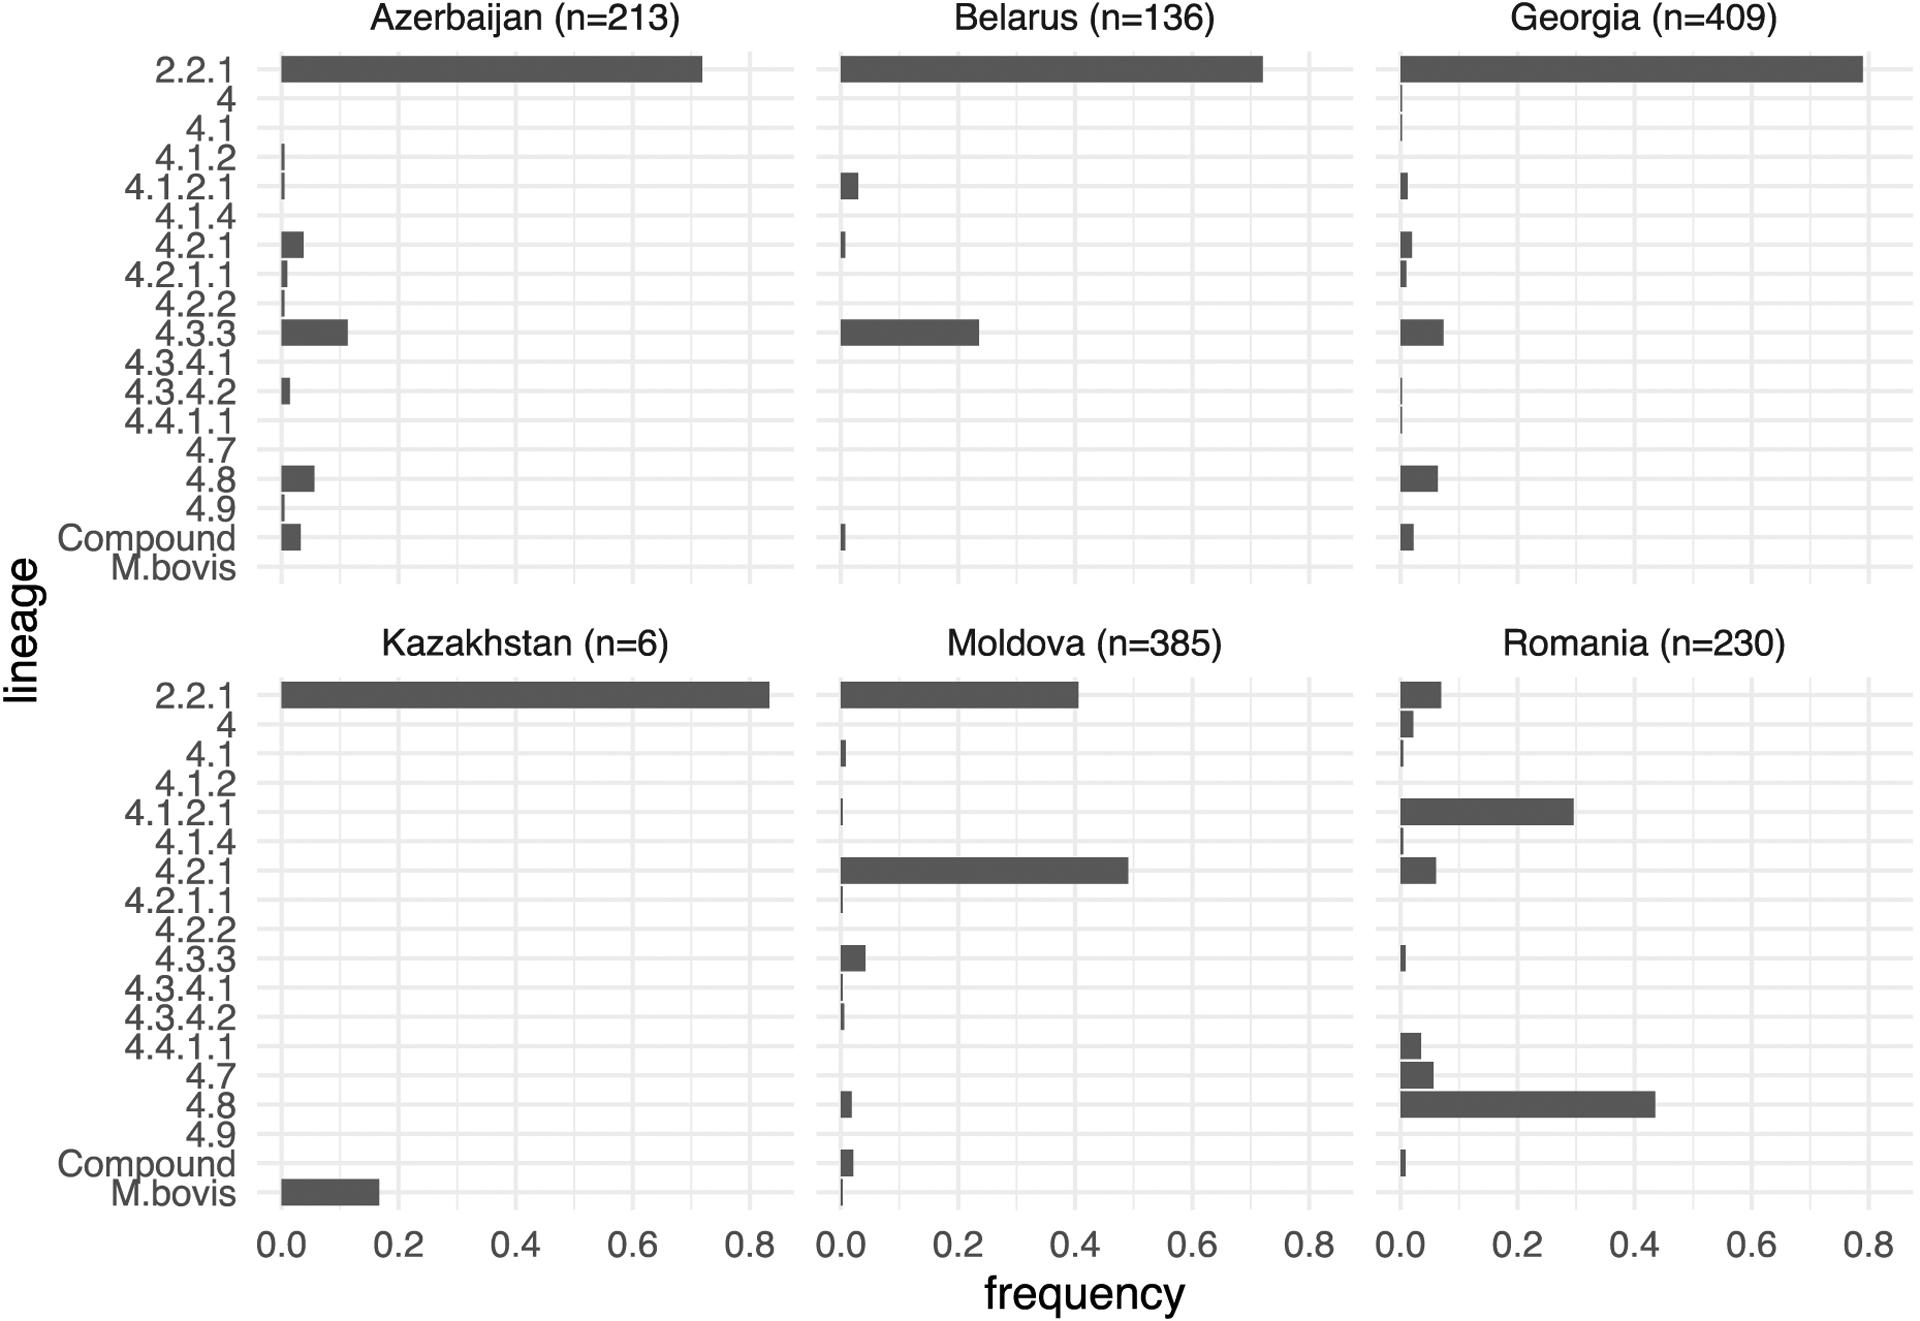
Figure 1.

Frequency distributions of phylogenomic sublineages for each country in the data. Total number of samples per country is shown in the header for each individual plot. Samples assigned to multiple sublineages are collected into the category “Compound”.
