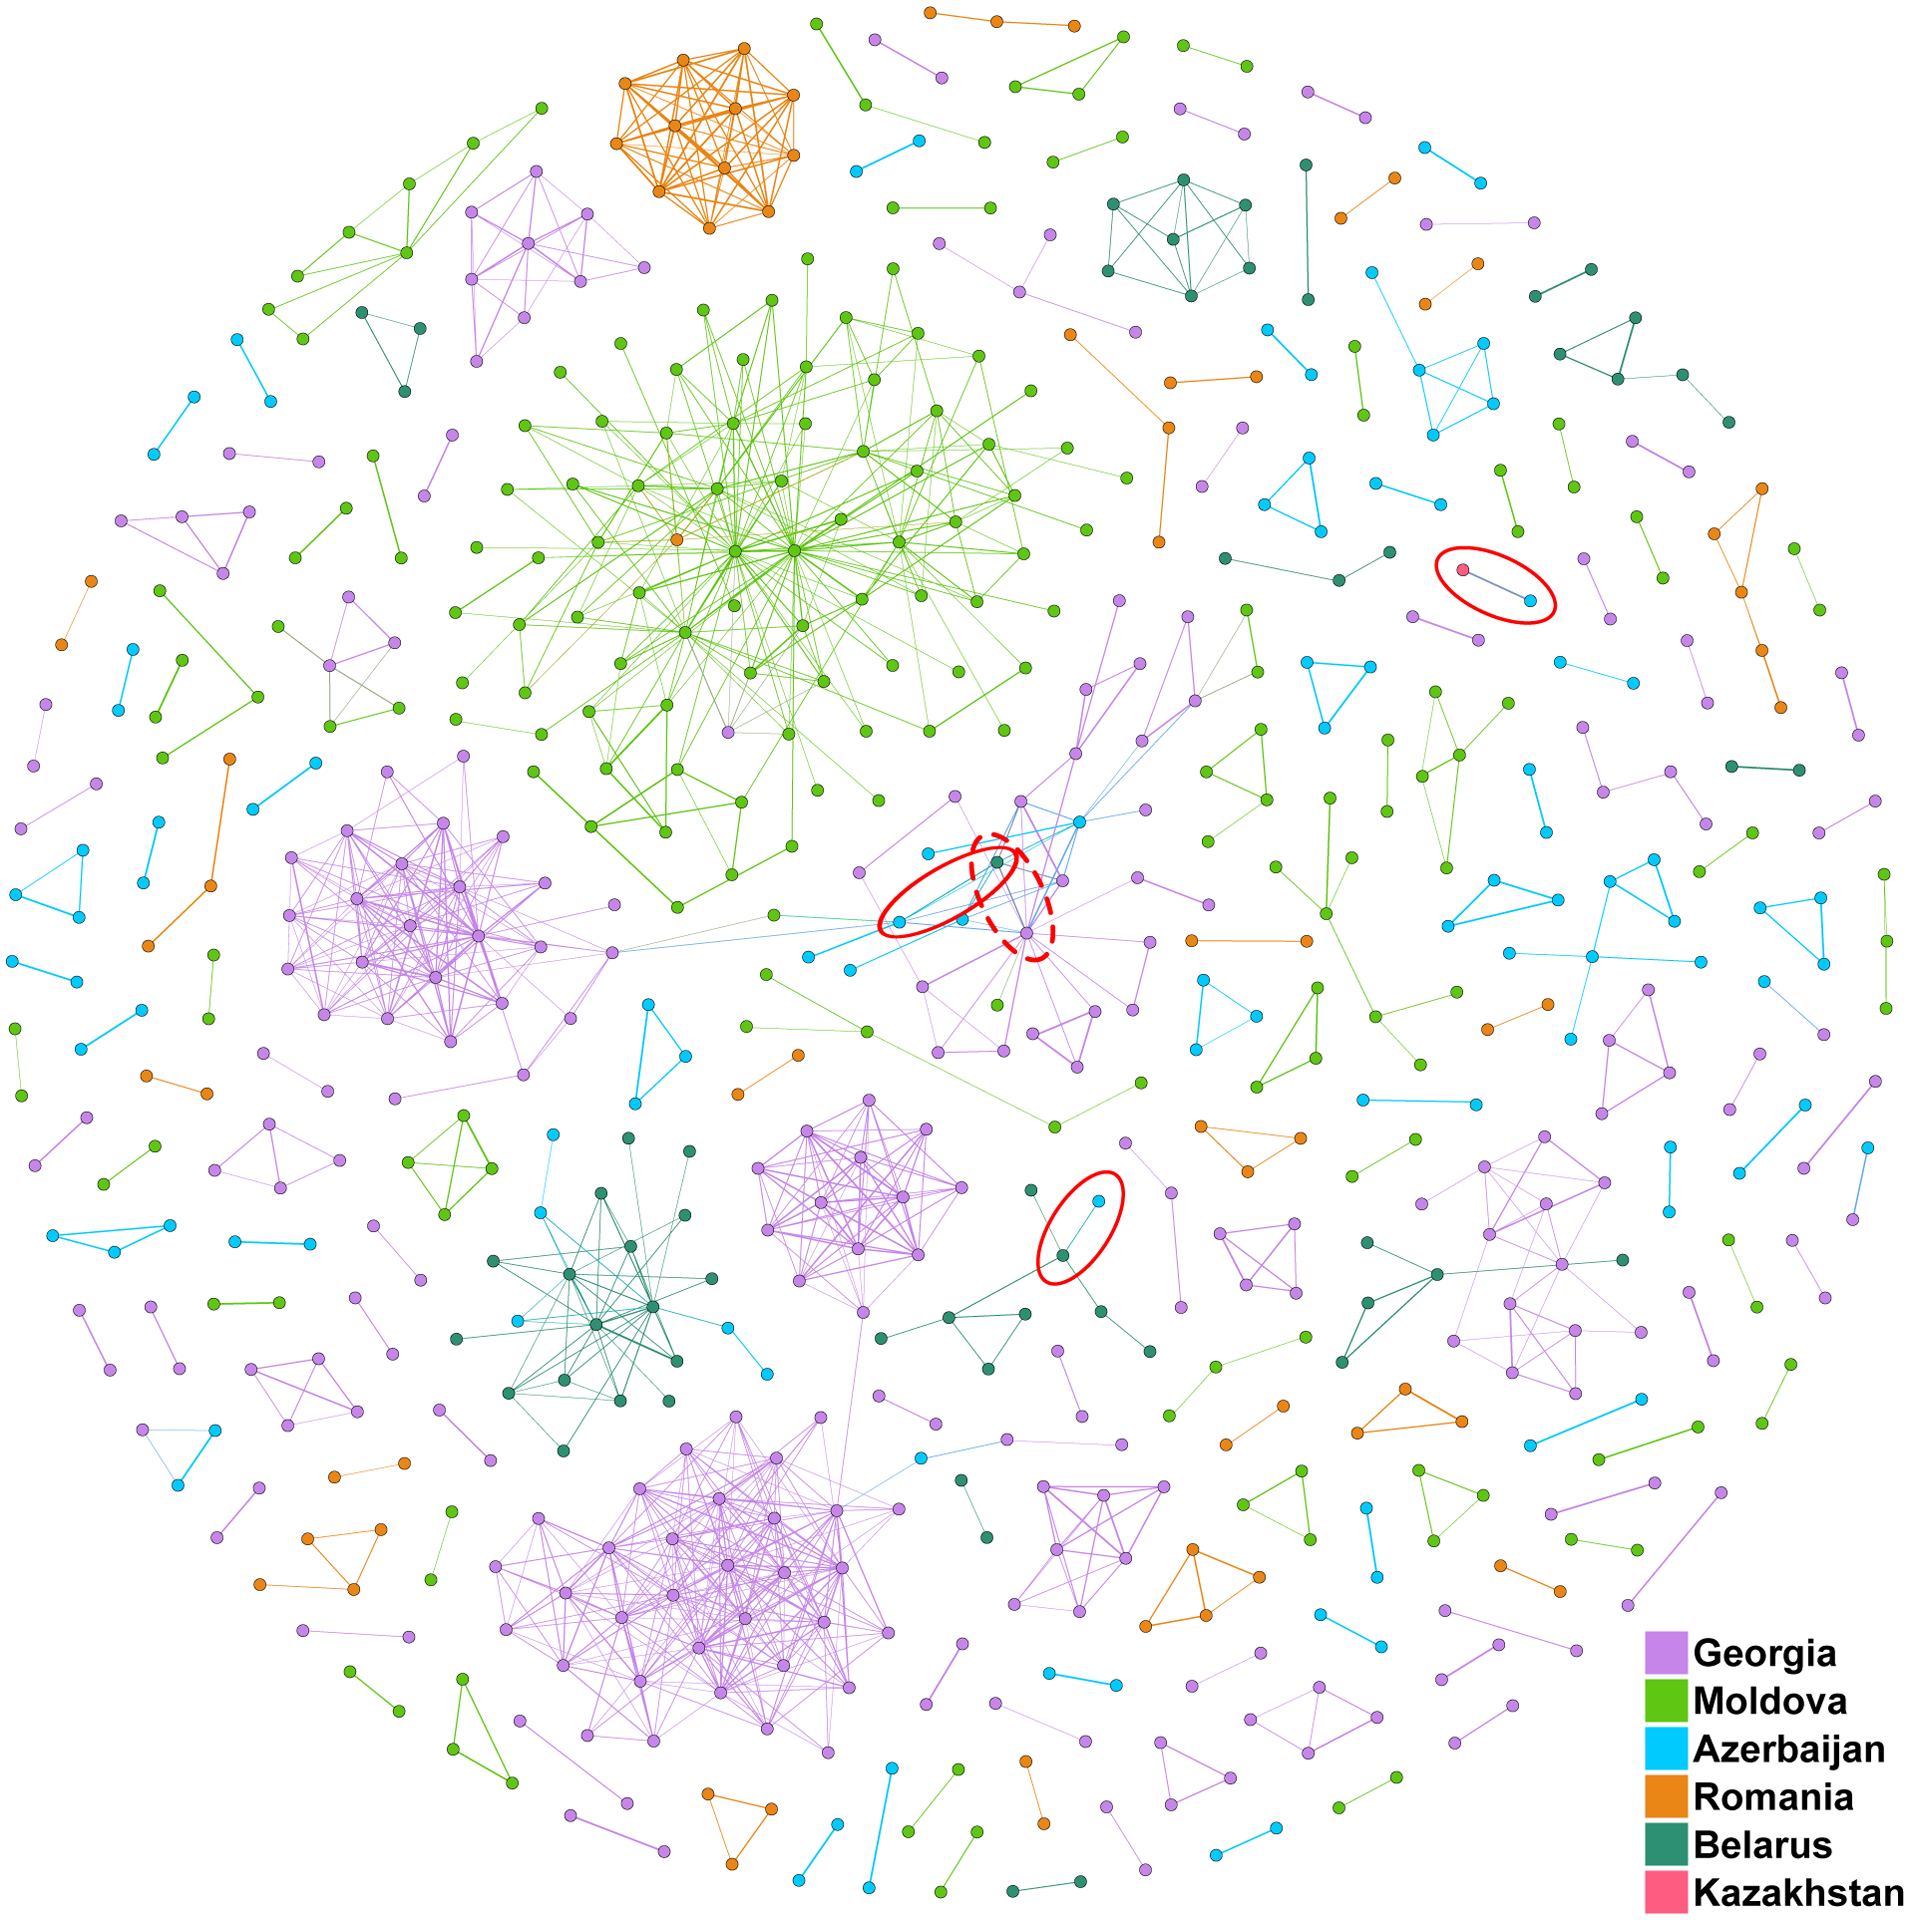
Figure 3.

Network diagram of samples separated by 10 genomic SNPs or less. Pairs of samples with number of SNP difference consistent with direct transmission indicated by red ovals. The dotted oval encloses the highly similar pair that includes the sample from Georgia that is potentially a mixed-infection sample.
