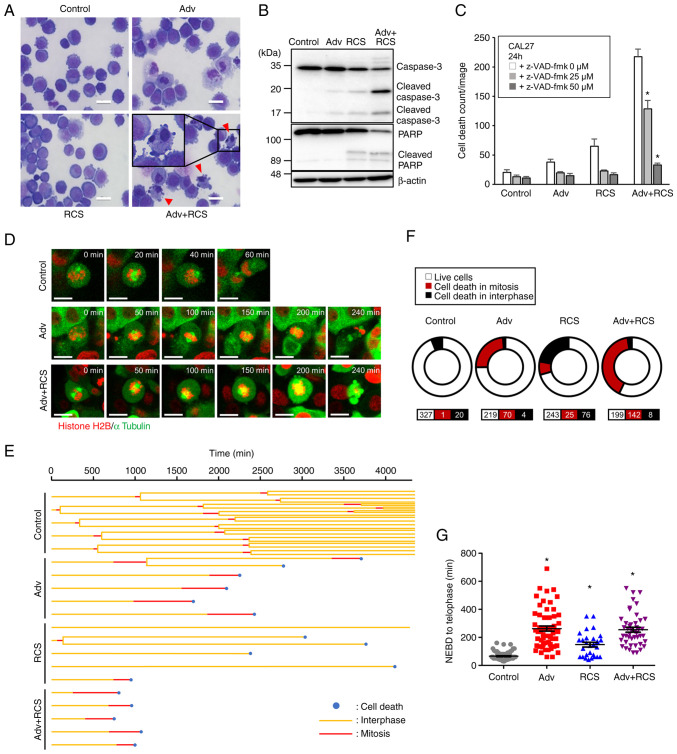
Figure 3.
Co-administration of ricolinostat enhances adavosertib-induced mitotic catastrophe in CAL27 cells. (A) CAL27 cells were treated with control, Adv (0.5 µM), RCS (5 µM), or Adv+RCS for 24 h and then stained with May-Grünwald-Giemsa stain. Scale bar, 25 µm. Arrowheads indicate nuclear chromatin condensation. (B) CAL27 cells were treated with control, Adv (0.5 µM), RCS (5 µM), and Adv + RCS for 24 h, and then, cleavage of PARP and caspase-3 were assessed by western blotting. (C) CAL27 cells were treated with control, Adv (0.5 µM), RCS (5 µM), or Adv + RCS in the presence of z-VAD-fmk (0, 25, and 50 µM) for 24 h, and dead cell number was monitored using IncuCyte live cell imaging system by PI staining. n=7, bar, mean ± SD; *P<0.05 vs. 0 µM z-VAD-fmk. (D) Live cell imaging of CAL27 cells expressing AcGFP-α-tubulin and Histone H2B-mCherry. Cells were treated with control, Adv (0.5 µM), or Adv + RCS (5 µM) and monitored using confocal microscopy. Representative images of cells after the nuclear envelope breakdown (NEBD) are shown. Time after the NEBD is shown in the upper right corner of each image. Scale bar, 20 µm. (E) Five representative cell fates in each treated cell with control, Adv (0.5 µM), RCS (5 µM), or Adv + RCS are shown in a tree diagram. (F) The ratio of cell death in mitosis or interphase in each treated cell is summarized in the pie chart. n for each condition is shown at the bottom. Data from three independent experiments are summarized. (G) Time from NEBD to telophase or cell death was assessed and summarized. n=75, 59, 29, 46. Data from three independent experiments are summarized. *P<0.05 vs. the control. PARP, poly(ADP-ribose) polymerase; Adv, adavosertib; RCS, ricolinostat.

