Figure 1.
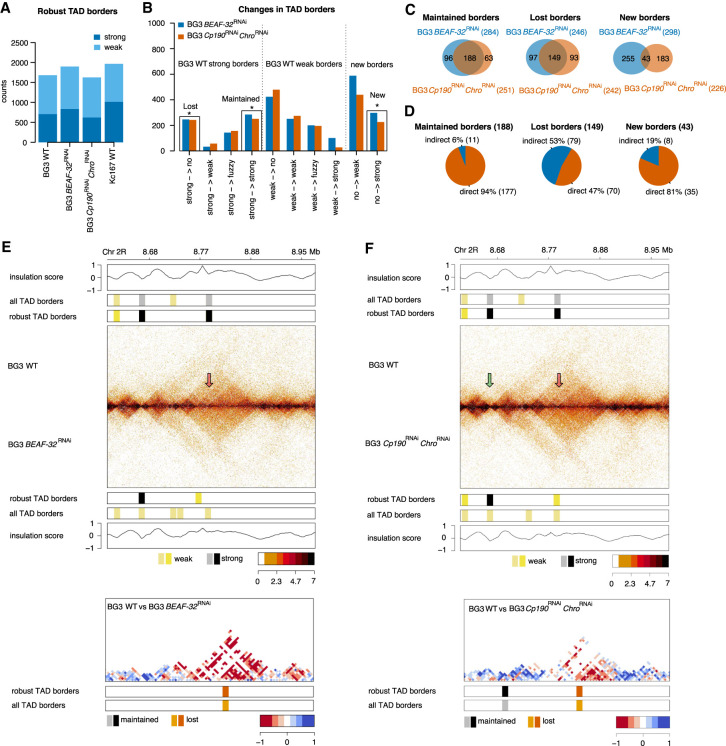
Functional roles of BEAF-32, Cp190, and Chro in TAD organization of BG3 cells. (A) Number of robust TAD borders in BG3 cells (WT, BEAF-32 knockdown, and Cp190 Chro double knockdown) (see Supplemental Fig. S3A). We also included the number of TAD borders in Kc167 cells. We split each class of TAD border into two subgroups: strong borders and weak borders, depending on whether the TAD borders can still be detected when increasing the stringency of the TAD-calling algorithm. (B) Classification of TAD borders as described in the main text: lost (borders that are strong in WT and completely disappear in the knockdown); maintained (borders that are strong in WT and are maintained strong in the knockdown); and new (borders that appear strong in the knockdown). (C) Overlap of lost, maintained, and new borders in the two knockdowns. (D) Number and percentage of maintained, lost, and new borders that have direct binding of BEAF-32, Cp190, and/or Chro (see Supplemental Fig. S4A). We considered common borders between the two knockdowns (BEAF-32 single knockdown and Cp190 and Chro double knockdown). (E,F) Examples of a genomic region at DpnII restriction size resolution for: (E) BEAF-32; and (F) Cp190 and/or Chro knockdowns. Darker colors indicate more contacts retrieved by in situ Hi-C. Green arrow indicates maintained borders and red arrows lost borders. From top to bottom, we plot the insulation score, TAD borders in the full data set (gray are strong and yellow are weak), TAD borders recovered both in the full and down-sampled data set (black are strong and yellow are weak), and contact map in WT cells. We also plot a mirror plot in the knockdowns (BEAF-32 knockdown or Cp190 Chro double knockdown) and log2fold change between WT and knockdown. To compute the log2FC, we followed the steps and parameters recommended in the diffHiC package (Lun and Smyth 2015). Briefly, we considered individual replicates and used the edgeR package (Robinson et al. 2010) to compute the log2FC in 5-kb bins.

