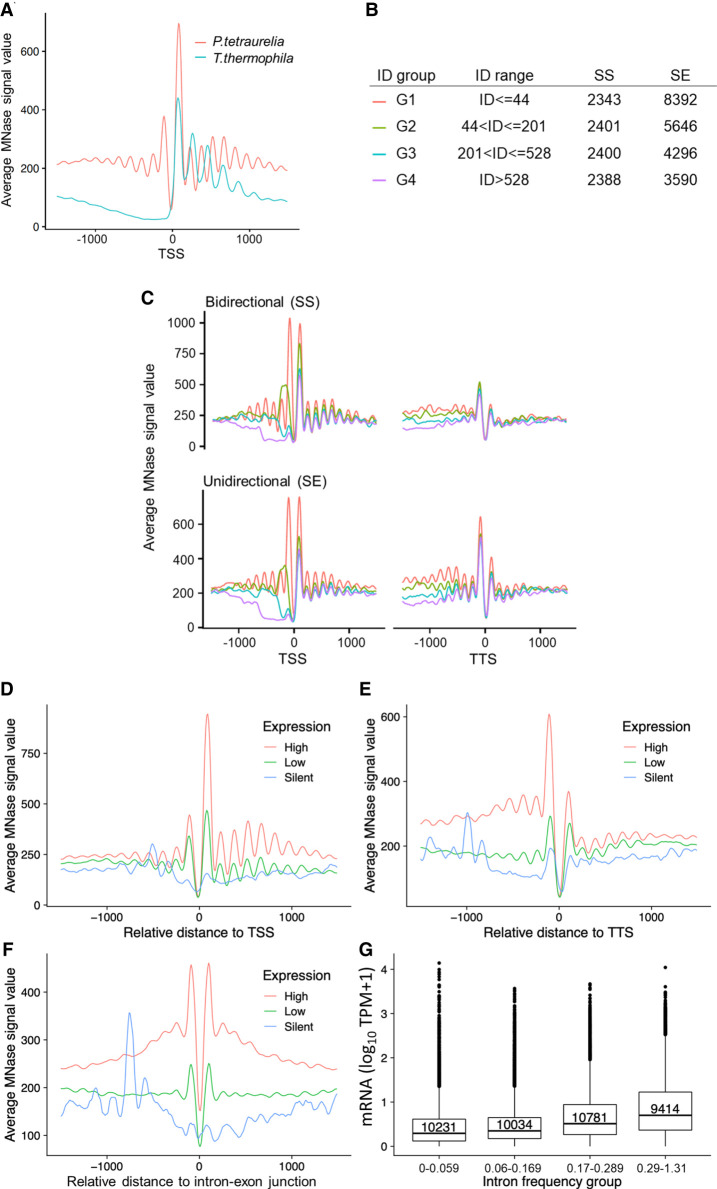
Figure 4.
Positioning of nucleosomes in relation to gene expression. (A) Profile plot for nucleosome distribution relative to the transcription start site (TSS) for all analyzed Paramecium genes. Signal for 1000 bp upstream of and downstream from the TSS is shown. For comparison, MNase-seq data from T. thermophila were plotted in the same manner. (B) Dissection of neighboring Paramecium genes based on their configuration and intergenic distance (ID). Table shows separation of genes by configuration and ID, ranked from short distances (G1) to long distances (G4). The last two columns indicate numbers of genes in each configuration and ID group. (C) Nucleosome profiles in a 2-kb window centered at the TSS (left) or the TTS (right) for neighboring genes in SS and SE configuration are shown. Genes were additionally separated by the length of intergenic distances; see color-coding in B. The nucleosome profiles in relation to their distance (x-axis) to TSS (D), TTS (E), and intron–exon junction (F) are shown for gene categories based on their expression levels. (G) Box plots showing the mRNA expression (y-axis; log10 TPM + 1) of genes with different intron frequency groups (number of introns per 100 bp; x-axis). A Kruskal–Wallis test showed that the expression distribution between all pairs of intron frequency groups is significantly different (P < 2.2 × 10⁻¹⁶).

