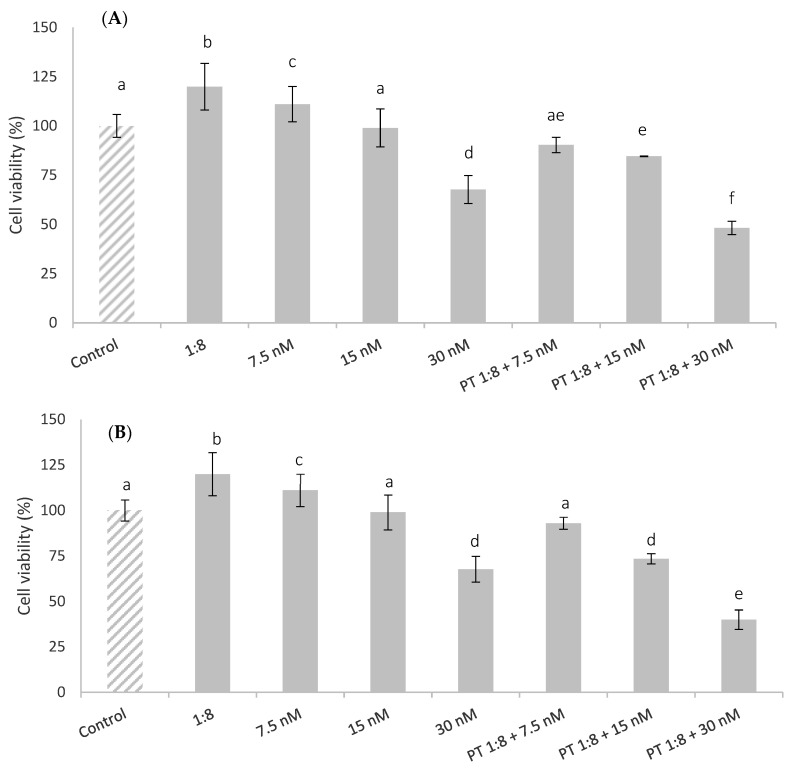
Figure 3.
HepG2 cell viability (%) of pre-treated cells (PT) with 1:8 red bean extract for 1 h (A) and 24 h (B) and afterward exposed to T-2 (7.5, 15, and 30 nM) during 24 h. All values are expressed as mean ± SEM of 3 replicates. Values in the same figure with different superscript letters are significantly different (p ≤ 0.05).

