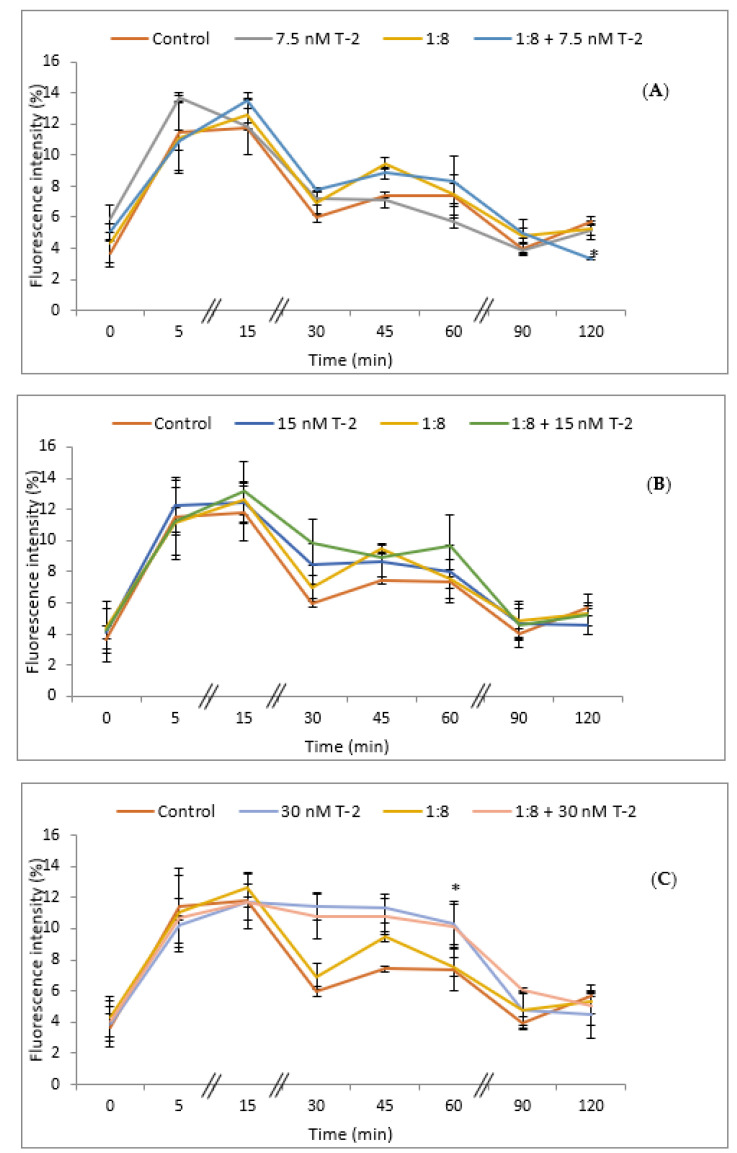
Figure 4.
Intracellular ROS production in HepG2 cells exposed to: (A) 7.5 nM T-2; (B) 15 nM T-2; (C) 30 nM T-2; and 1:8 diluted red bean extract, alone or in combination, after 0, 5, 15, 30, 45, 60, 90, and 120 min. All values are expressed as mean ± SEM of 4 replicates. (*) p ≤ 0.05 represents significant difference as compared to control values.

