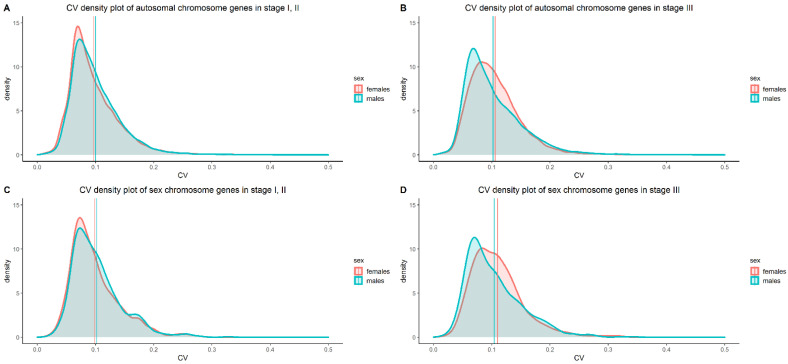
Figure 2.
CV density plots, of the LMC gene expression data, on the sexes was created for: (A) autosomal chromosome genes in stage I, II; (B) autosomal chromosome genes in stage III; (C) sex chromosome genes in stage I, II, and (D) sex chromosome genes in stage III. The vertical lines on the x-axes represent the average CV of each sex for each analyzed subcategory.

