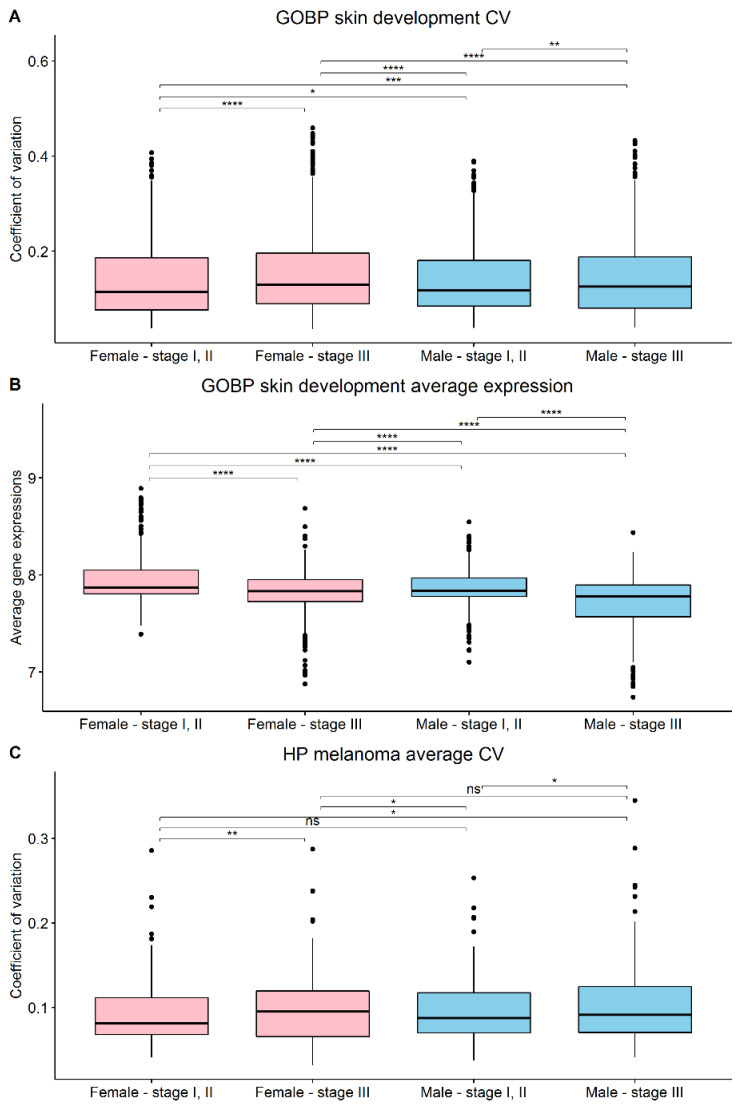
Figure 3.
Boxplots on the sex/stage stratifications were constructed on (A) CVs of the gene signature for GOBP_skin_development, (B) gene expression averages of the gene signature for GOBP_skin_development, and (C) CVs of the gene signature for HP_melanoma. ns = not significant, * p < 0.05, ** p < 0.01, *** p < 0.001, **** p < 0.0001.

