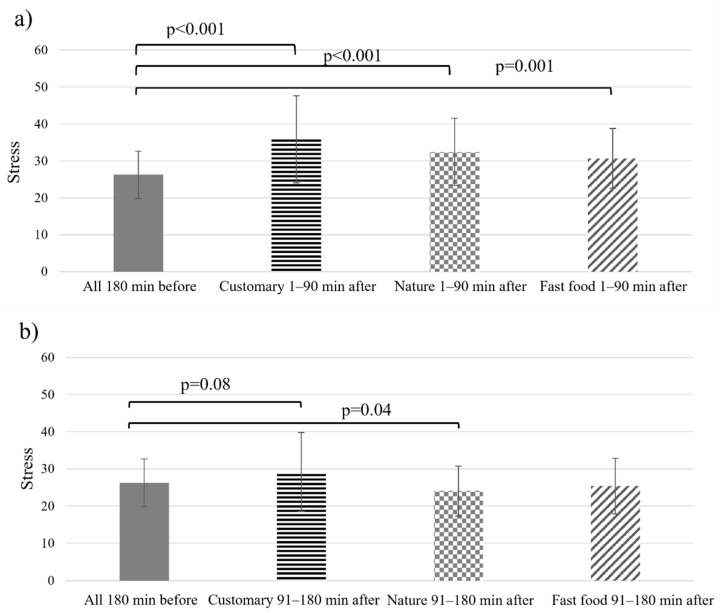
Figure 5.
Averages of median objective stress 180 min before lunch (all weeks combined) and (a) 1–90 min after lunch and (b) 91–180 min after lunch. Scale: 0–25 = resting state, 26–50 = low stress, 51–75 = medium stress, 76–100 = high stress. Error bars are standard deviations of the medians. Data from the subgroup of participants (n = 32).

