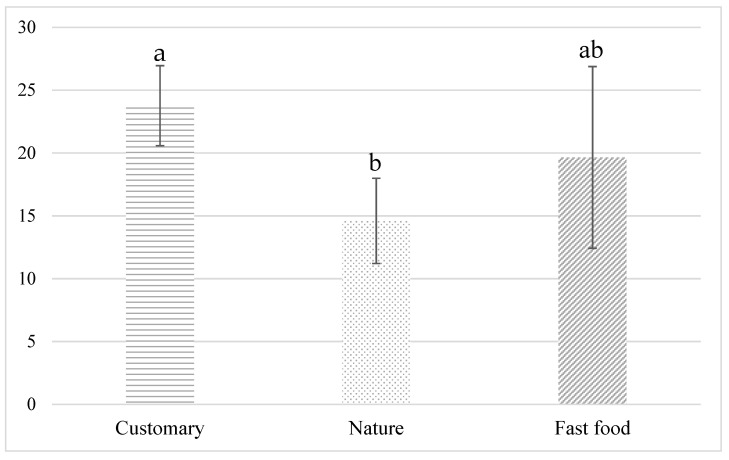
Figure 7.
Average plate waste in grams per customer during the ‘customary ambience’, ‘nature ambience’ and ‘fast food ambience’ weeks. Data from each day of the study weeks (n = 15). Error bars are standard deviations of the five days of the study week. Different letters above the bars indicate statistically significant difference (p ≤ 0.1) between the study weeks.

