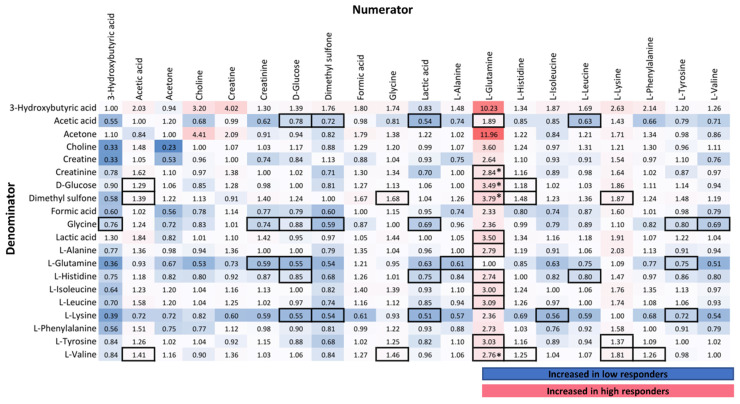
Figure 2.
Fold-change of high vs. low responders of metabolic ratios in Day 1. Columns show the numerator and rows the denominator of each ratio. For example, the l-Glutamine/d-Glucose ratio exhibits a 3.49-fold increase in the high responders compared to the low responders. The changes in the metabolic ratios found statistically significant using t-tests (p-value < 0.05) are in boxes. Asterisks (*) indicate statistical significance after FDR correction (p-value < 4.62 × 10⁻⁴). Color coding is based on conditional formatting of fold-change values.

