Figure 1.
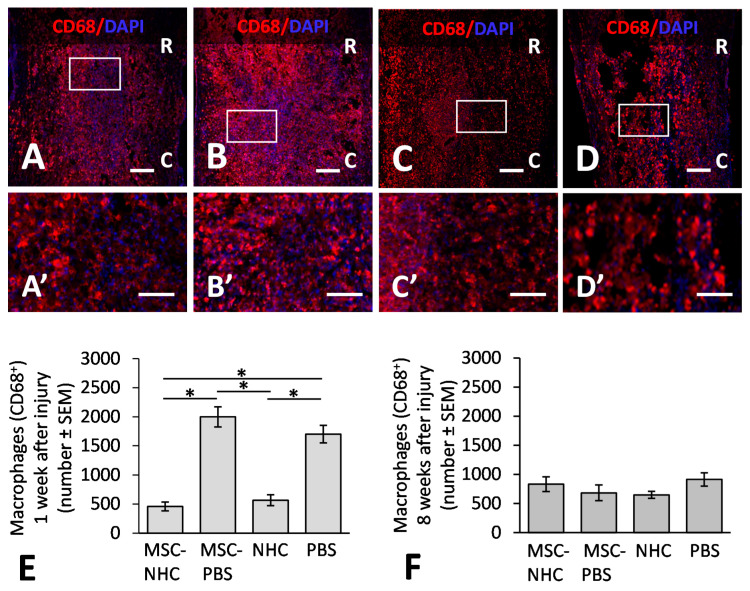
CD68 inflammatory response in the injury site. Photomicrographs showing macrophages stained for CD68 (red), a pan-macrophage marker, and the nucleus marker, DAPI (blue), in the injury site with MSC-NHC (A), MSC-PBS (B), NHC (C), or PBS (D) at 1 week after injury. Images in panels (A’–D’) are enlargements of the outlined area in panels (A–D), respectively. Scale bar in (A,C,D) is 250 µm, and 200 µm in (B). The scale bar in (A’–D’) is 100 µm. In (A–D), the rostral (R) and caudal (C) orientation of the horizontal sections are indicated. (E) Bar graph showing the average number of CD68+ macrophages in the injury site of each group at 1 week after injury. There are significantly less macrophages in the injury site with MSC-NHC and NHC only compared with MSC-PBS and PBS only. (F) Bar graph showing the average number of CD68+ macrophages in the injury site of each group at 8 weeks after injury. The differences in numbers of CD68+ macrophages in the injury site of the four groups were not statistically significant. In both graphs, the asterisks indicate p < 0.05, and the bars represent SEM. Abbreviations: DAPI = 4′,6-diamidino-2-phenylindole; MSC = mesenchymal stromal cells; NHC = nanofiber-hydrogel composite; PBS = phosphate-buffered saline; SEM = standard error of the mean.

