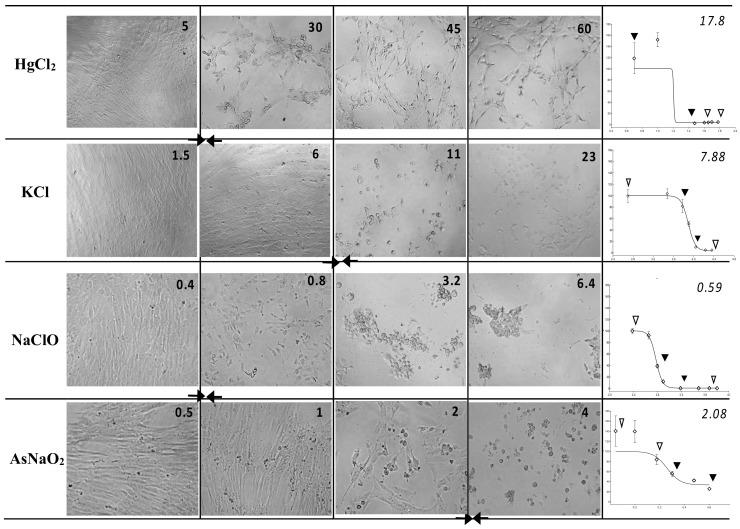
Figure 1.
Cytotoxicity in WJSCs following 48 h of exposure to various concentrations of chemicals—Left panel: micrographs (25×) of WJSCs 48 h after exposure to four chemicals representative of four hazard classes; the four concentrations are shown from highest (far right) to lowest (leftmost column). Figure inserts in top right corner of each micrograph denote the exact concentration (in ug/mL) of the chemical used. Right panel: respective survival curves (y = % viability, x = concentration in log ug/mL) for each chemical and their IC50 values (ug/mL; top right corner of plots). Arrows on survival curves depict the four respective concentrations shown on the micrographs on the left. Diamonds depict all tested concentrations. IC50 values correspond to the curve area between the two solid arrowheads and the culture status delineated by the micrographs marked by two solid arrows in the left panel.

