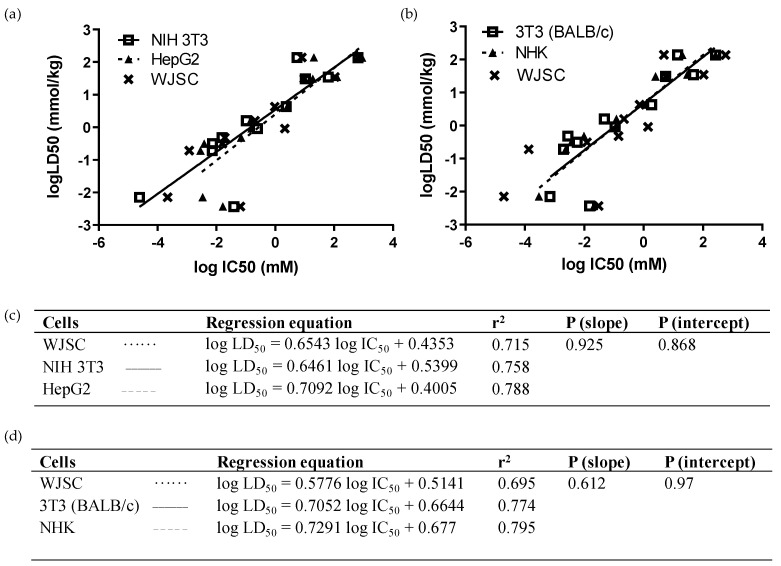
Figure 3.
Comparison of linear regressions of WJSCs with human and murine cell lines after 48 h of treatment with the 12 selected chemicals: (a,c) In vitro comparison with ΝΙH 3Τ3 (solid line, open squares) and HepG2 cells (dashed line, closed triangles). Data were obtained by means of the MTS assay. Regression equations, r2, and p-values were generated and used to compare predictability of the assays. (b,d) In silico comparison with BALB/c 3Τ3 (solid line, open squares) and NHK cells (dashed line, closed triangles). Data for WJSCs were obtained via the NRU method in our lab, while data for BALB/c 3T3 and NHK cells, and the respective LD50 values, were derived from the ICCVAM validation study [6]. The WJSC regression line is represented in both analyses by a dotted line with data points marked as “x” symbols. Regression equation, r2, and p-values were generated and used to compare the predictability of the assays.

