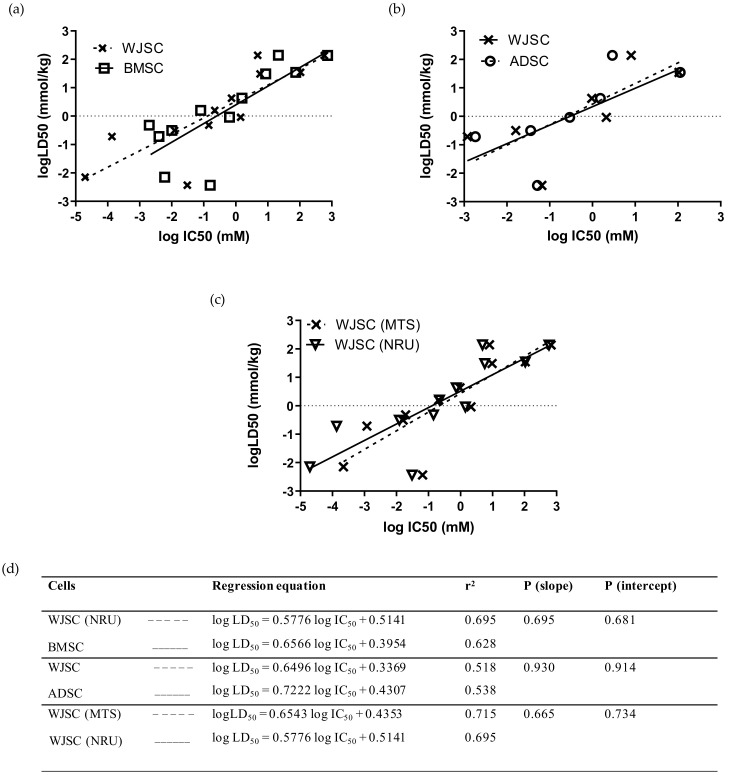
Figure 4.
Comparison of linear regressions of human fetal WJSCs with two types of human adult MSCs: (a) Comparison with BMSCs for the full panel of 12 chemicals using the NRU assay. (b) Comparison with ADSCs for a subgroup of seven selected chemicals (mercury(II) chloride, sodium arsenite, sodium dichromate dihydrate, sodium fluoride, propranolol hydrochloride, potassium chloride, and sodium hypochlorite) by means of MTS assay. (c) Comparison of the linear regressions generated by evaluating the toxicity of 12 chemicals on WJSCs using the MTS and NRU assays. The regression data presented here were generated by independent in vitro experiments in our lab, except for data regarding BMSCs and LD50 values, which were derived from the work by Scanu et al. [14] and by the ICCVAM validation study [6], respectively. Linear regression plots (top panel) are shown as dashed lines with data points marked as “x” symbols (WJSCs), solid lines with open squares (BMSCs), and dashed lines with open circles (ADSCs). (d) Regression parameters in tabular format for each of the regression graphs. In all cases, regressions did not differ significantly (p > 0.05, F-test).

