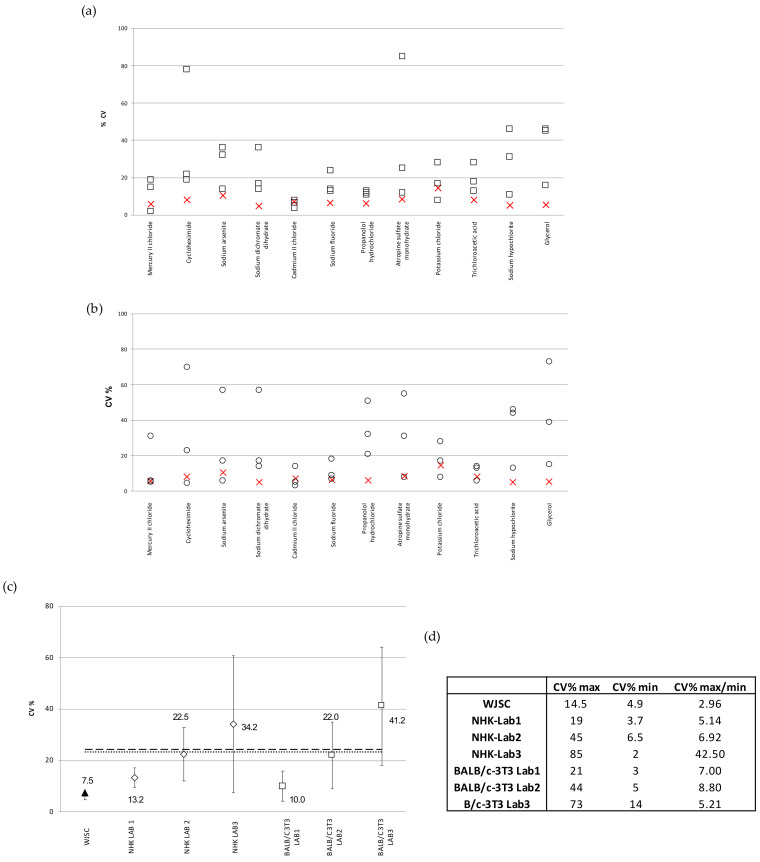
Figure 6.
Reproducibility of the WJSC-based toxicity assay: (a) Comparison of inter-laboratory variation (CV%) of IC50 values calculated by NHK-NRU toxicity assay in three different laboratories selected by the ICCVAM [6] (values displayed as squares), with those calculated based on the WJSC-NRU assay in our laboratory (values shown as “X”). The three plus one values in each column are the CV% values as recorded in the three ICVAAM laboratories and in our laboratory, respectively, for each of the 12 different substances, presented in descending order of toxicity from left to right along the x axis; (b) Comparison of inter-laboratory variation (CV%) of IC50 values calculated based on the BALB/c 3T3-NRU toxicity assay (in three different laboratories selected by ICCVAM; values are shown as squares) with those calculated based on the WJSC-NRU assay in our laboratory (values shown as “X”). The three plus one values in each column are the CV% values as recorded in the three ICVAAM laboratories and in our laboratory, respectively, for each of the 12 different substances, presented in descending order of toxicity from left to right along the x axis. (c) Comparison of the mean inter-laboratory variation (CV% ± standard deviation) of IC50 values derived from the three experimental triplicates with the lowest deviation for the total of 12 substances; horizontal lines = mean CV% of three labs (dashed = 3T3, dotted = NHK. (d) Mean inter-laboratory variation values (CV%) for the total of 12 substances tested.

