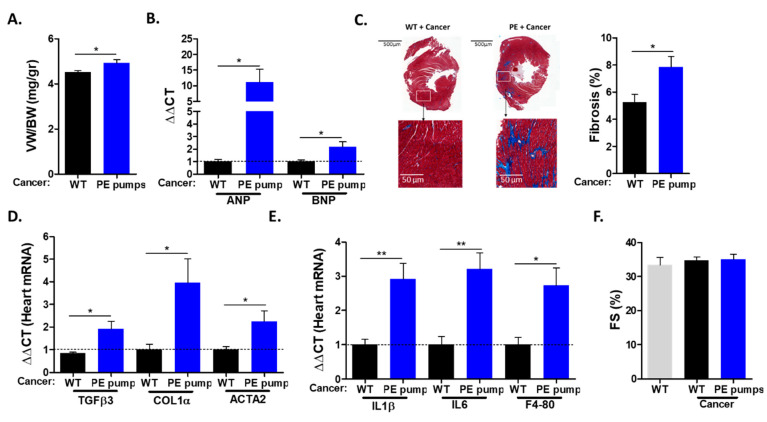
Figure 2.
Cardiac remodeling hallmarks following PE infusion. (A) Ventricle weight (VW) to body weight (BW) ratio at the endpoint. (B) The mRNA levels of hypertrophic markers ANP and BNP were determined via qPCR, normalized with GAPDH. Data are presented as mean ± SEM relative expression compared to control hearts, determined as 1. (C) Representative images and quantification of heart sections (n = 4, at least 5 fields per mouse) stained using Masson’s trichrome. Scale bar: 500 and 50 µm. (D,E) Heart mRNA levels of fibrosis markers TGFβ3, collagen 1α and Acta2 (D) and inflammation markers IL-1β, IL-6 and F4-80 (E) were determined via qRT-PCR, normalized with GAPDH. (F) Echocardiography was performed one day prior to sacrifice. Fractional shortening (FS) was assessed according to the formula: FS (%) = ((LVDd − LVDs)/LVDd)). Data are presented as mean ± SEM relative expression compared to control hearts, determined as 1. Data were analyzed via multiple Student’s t-tests. * p <0.05. ** p <0.01.

