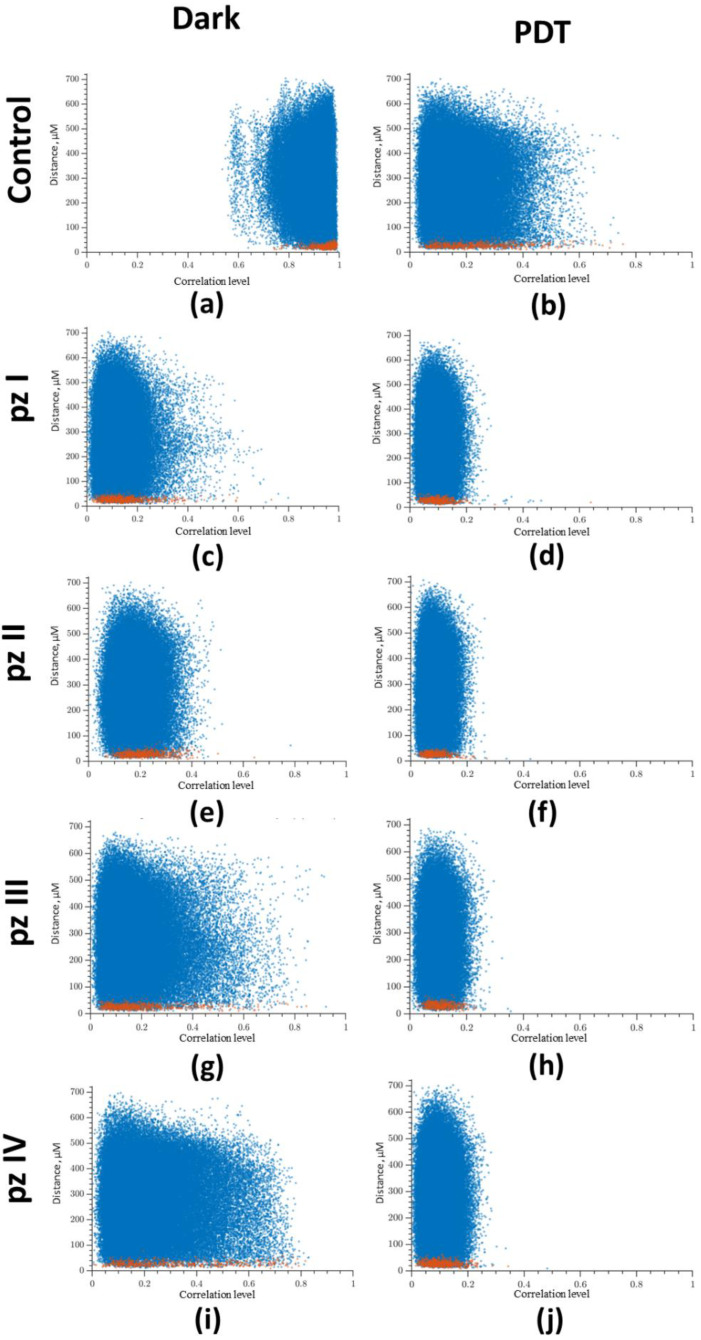
Figure 5.
Dependence between the correlation level and the distance of cells pairs. The adjacent cell pairs with their soma in direct contact are highlighted in red: (a) control dark, (b) control PDT, (c) pz I control, (d) pz I PDT, (e) pz II control, (f) pz II PDT, (g) pz III control, (h) pz III PDT, (i) pz IV control, and (j) pz IV PDT.

