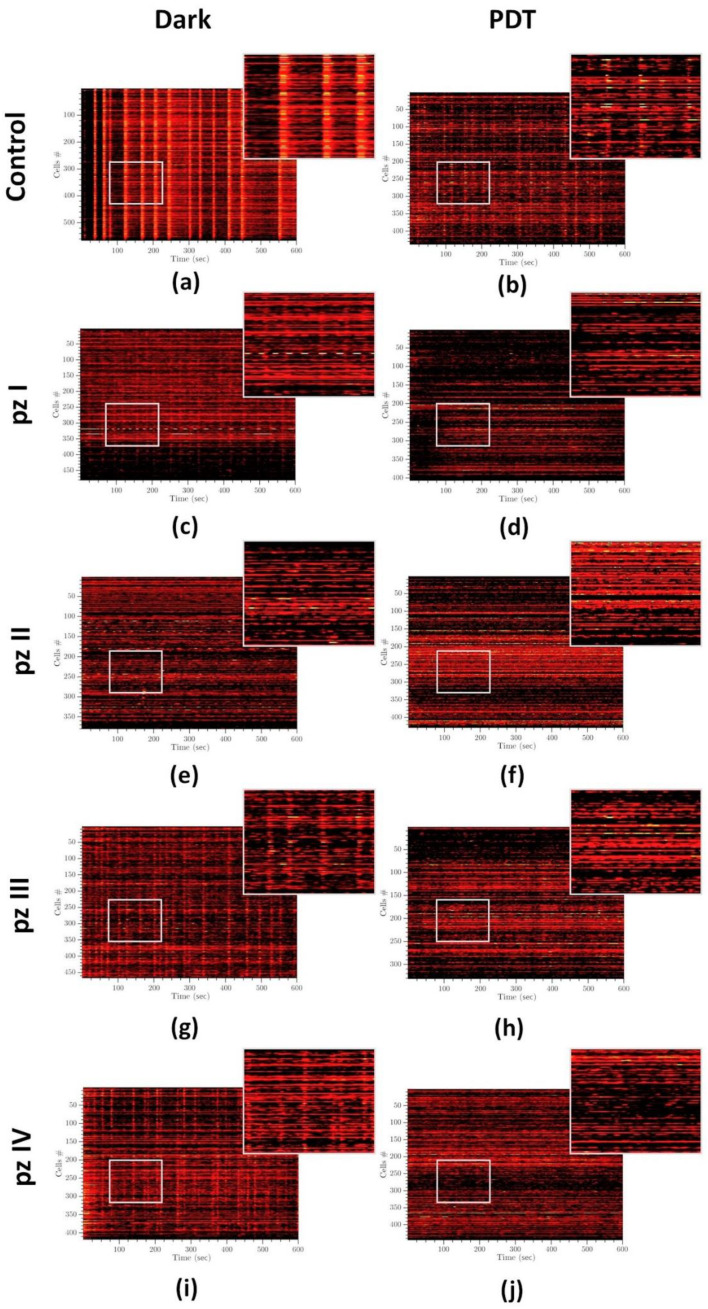
Figure 6.
Representative raster diagrams of spontaneous calcium activity of primary hippocampal cultures the next day after PDT. The X-axis represents the time of recording; the Y-axis represents the number of active cells, respectively. The lighter the point, the more intense the fluorescence. Treatments of the following: (a) control dark, (b) control PDT, (c) pz I control, (d) pz I PDT, (e) pz II control, (f) pz II PDT, (g) pz III control, (h) pz III PDT, (i) pz IV control, and (j) pz IV PDT.

