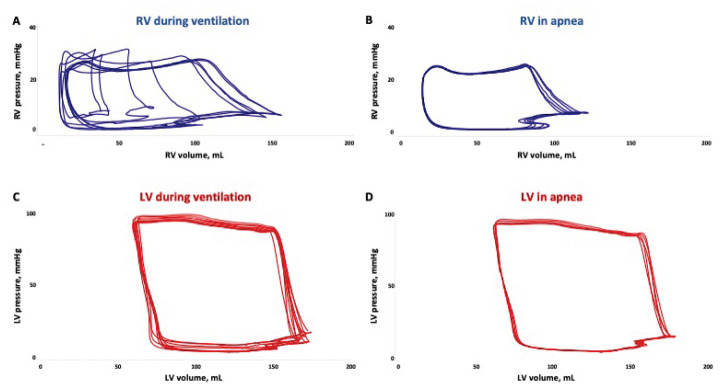
Fig. 3.
Representative pressure-volume loops from right ventricle (RV) with ongoing mechanical ventilation (A) and in transient apnea (B). Note how RV volumes changes substantially through the respiratory cycle. Similar loops from the left ventricle (LV) with ongoing ventilation (C) and in apnea (D). The differences between ventilatory mode are less pronounced for the LV than the RV. Both (A) and (C) shows loops from two consecutive respiratory cycles.

