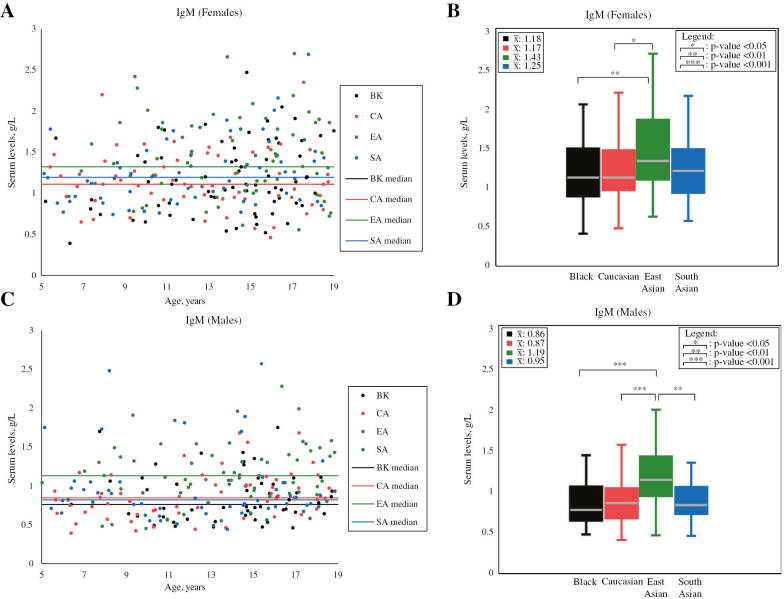
Figure 3:
Scatterplots and boxplots of female and male IgM concentrations partitioned by ethnicity.
Scatterplots and boxplots compare IgM male (A–B) and female (C–D) concentrations between participants of different ethnicities in the prospective analysis. Mean values (unadjusted for age) are shown in the top left corner of boxplots. p-Values shown in boxplots were calculated without adjusting for age, as age difference is not indicated by a previous CALIPER reference interval study [3]. Statistically significant ethnic differences were found to exceed RCVs (see Table 1). IgM, immunoglobulin M. Note: outliers are not shown in scatterplots and boxplots. Values are in SI units.

