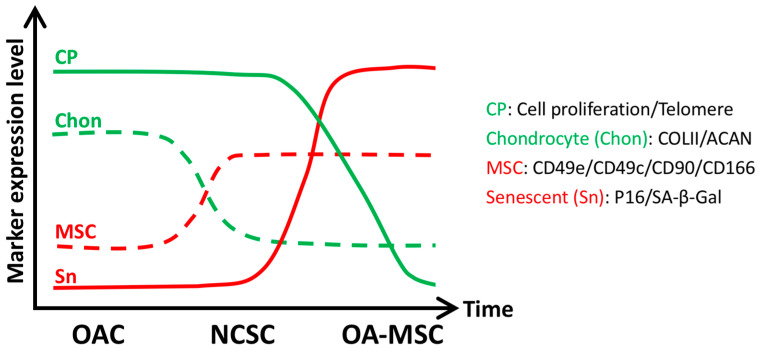
Figure 2.
Comparisons of key characteristics among OACs, NCSCs, and OA-MSCs (Y-axis, marker expression level) during the aging process (X-axis, Time) [21,28]. Somatic cell markers including chondrocyte proliferation (telomere length) and differentiation (COLII/ACAN mRNA levels) decrease as cells transition from OAC to NCSC to OA-MSC during aging. Markers for cell senescence (P16/SA-β-gal) and MSC (CD49e/CD49c/CD90/CD166) increase as cells transition from OAC to NCSC to OA-MSC during aging. OA: Osteoarthritis; OAC: osteoarthritic chondrocytes; NCSC: normal cartilage stromal cell; OA-MSC: osteoarthritic-cartilage mesenchymal stromal cell.

