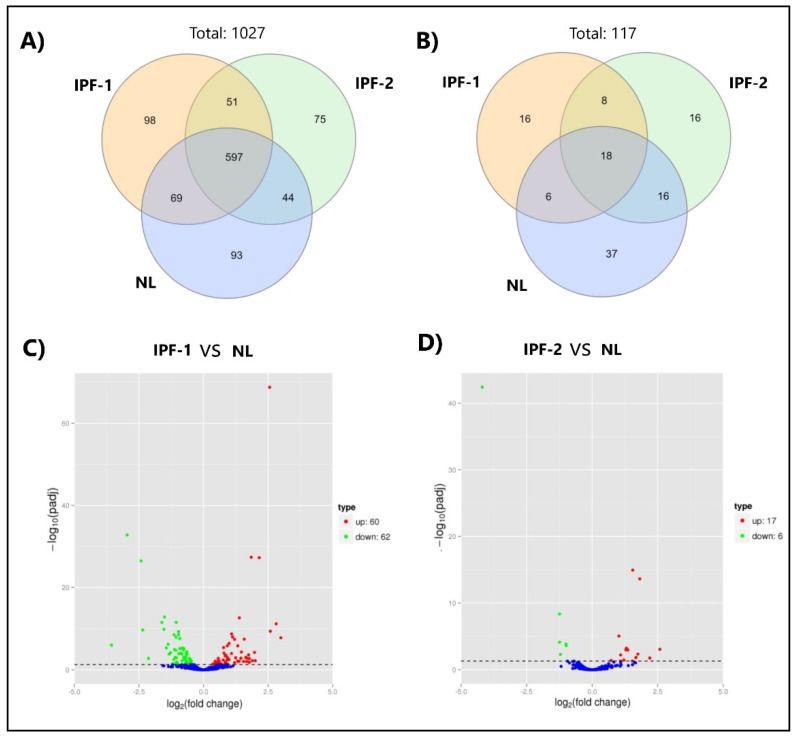
Figure 2.
miRNAs expressed in EVs of IPF fibroblasts. (A) Venn diagram shows known miRNAs shared in IPF-1, IPF-2, and NL groups. (B) Venn diagram shows novel miRNAs shared in IPF-1, IPF-2, and NL groups. (C,D) Volcano plots of differentially expressed miRNAs within EVs from IPF-1 vs. NL and IPF-2 vs. NL. The x-axis shows the fold change of miRNAs expression, and the y-axis shows the statistical significance (p adjusted threshold < 0.05), The dot representing each miRNA, blue dots indicate no significant difference miRNA, red dots indicate significant upregulation of miRNA, green dots indicate significant difference by miRNA.

