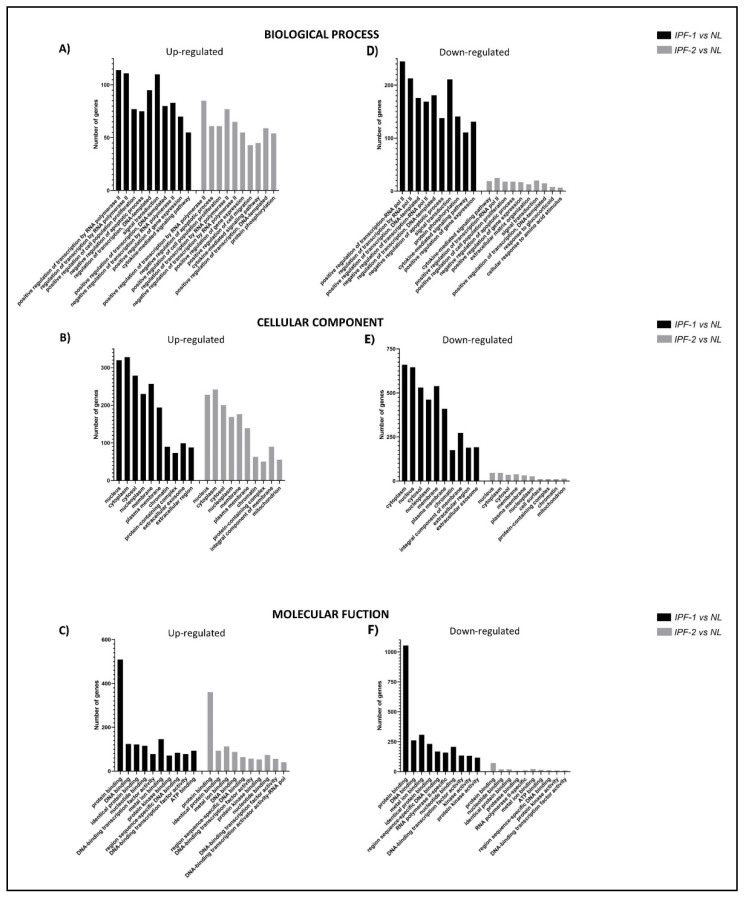
Figure 3.
Gene ontology enrichment analysis of target genes regulated by DE-miRNAs in EVs. Using the top DE-miRNAs, gene ontology was determined using the GeneCodis platform. (A–C) Top 10 target gene terms in Biological Processes, Cellular Components, and Molecular Functions category for upregulated miRNAs. (D–F) 10 classes with the highest number of target genes in GO categories for downregulated miRNAs. The x-axis shows GO terms of ontologies, and the y-axis indicates the number of target genes annotated in GO terms.

