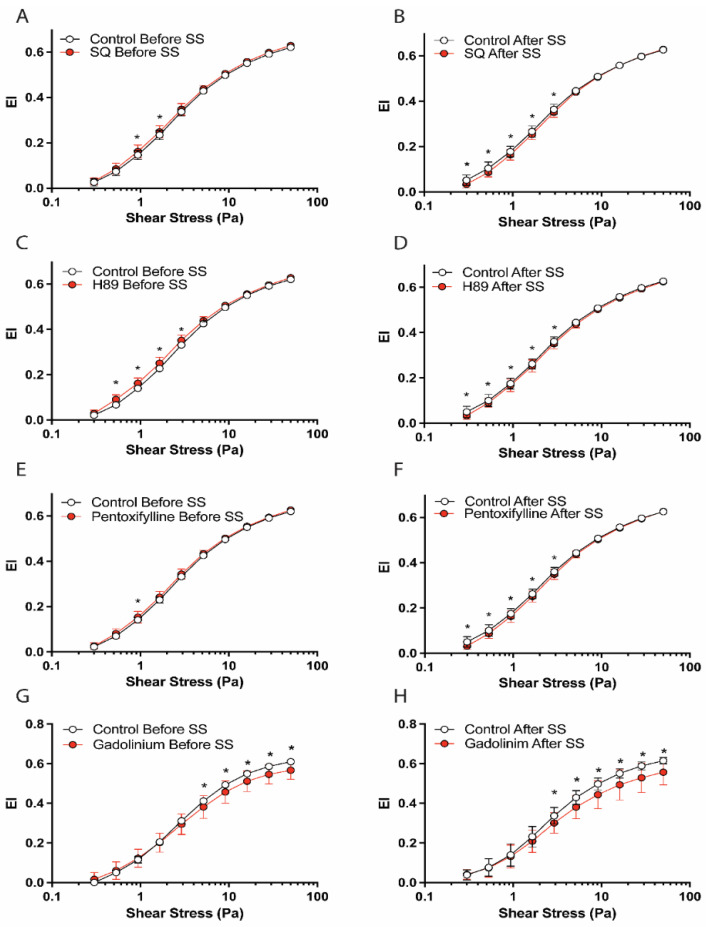
Figure 1.
EI–SS curves before and after 5 Pa SS exposure. The graphs demonstrate deformability changes by SQ22536 (A,B), H89 (C,D), pentoxifylline (E,F), and gadolinium (G,H) compared to the control. Panels (A,C,E,G) show deformability curves before SS exposure and panels (B,D,F,H) show deformability curves after SS exposure. Data are represented as means ± SD, n = 12, * p < 0.05.

