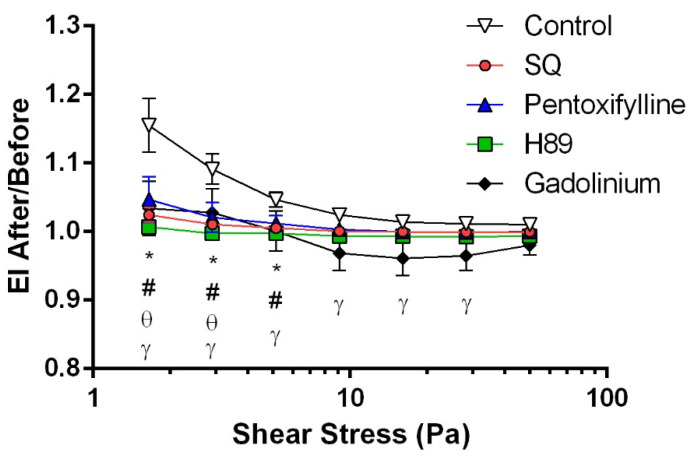
Figure 2.
Ratio of the elongation index (EI) values measured after and before the application of 5 Pa shear stress. * p < 0.05 control vs. SQ, θ p < 0.05 control vs. pentoxifylline, # p < 0.05 control vs. H89, and γ p < 0.05 control vs. gadolinium. Data under 0.95 Pa are not plotted. Data are represented as means ± SE, n = 12.

