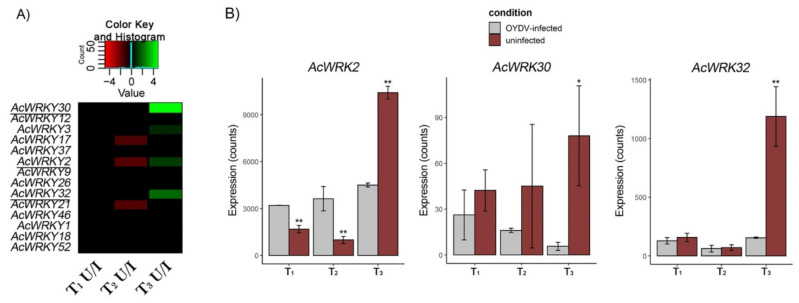
Figure 4.
Expression levels of AcWRKY genes isolated in onion bulb at the beginning of dormancy (T1), late dormancy (T2), and the dormancy release (T3). (A) Heatmap developed using log2 FC values (by Deseq2) of AcWRKYs for uninfected (U)/OYDV-infected (I) bulbs compared at each time; AcWRKYs showing significant differences by RNASeq (p < 0.05; log2 FC > 1) and qPCR between the two conditions during dormancy release (T3) were underlined. (B) Normalized RNA-Seq counts of AcWRKY2, 30, and 32 at each sampling time, detected in uninfected (red) and OYDV-infected (gray) samples. ** p < 0.05, * p < 0.1 (between infected and uninfected bulbs).

