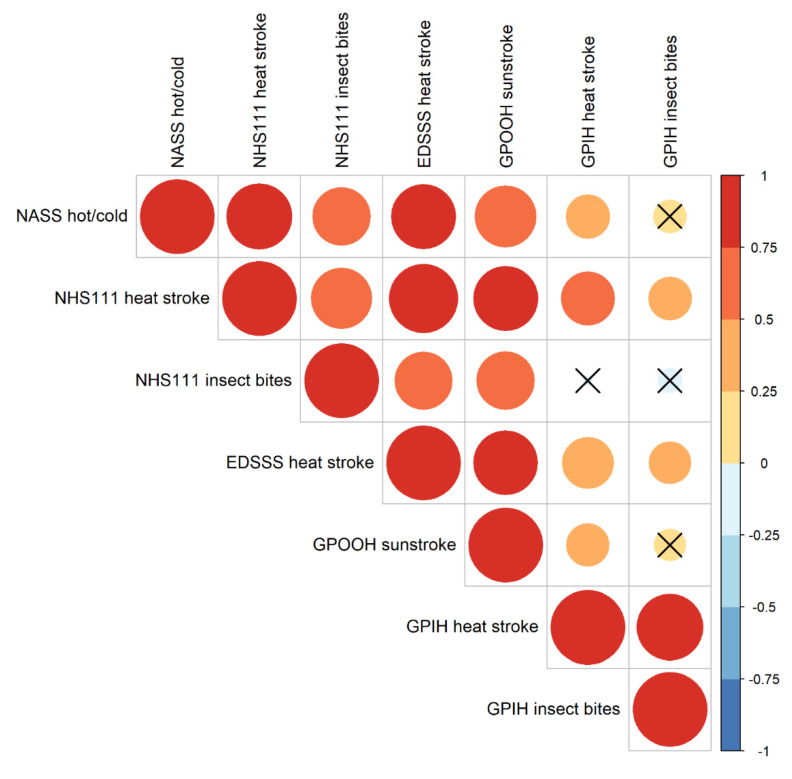
Figure 3.
Correlation between NASS heat/cold exposure CPC calls and related syndromic indicators from telehealth (NHS 111), emergency department (EDSSS), GP in hours (GPIH), and GP out of hours’ (GPOOH) systems. Each circle represents a correlation pair (small circles represent a weak and large a strong correlation, respectively), with the color and size dependent on the pairs correlation co-efficient (r). Circles without crosses represent significant correlations and circles with crosses signify non-significant correlation between indicators.

