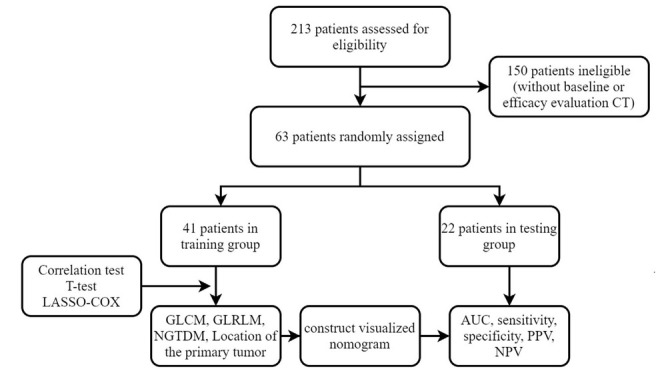
Figure 1.

Flowchart of study inclusion and exclusion. AUC: area under the curve; CT: computed tomography; GLCM: gray level co-occurrence matrix; GLRLM: gray level run length matrix; NGTDM: neighborhood gray tone difference matrix; NPV: negative predictive value; PPV: positive predictive value.
