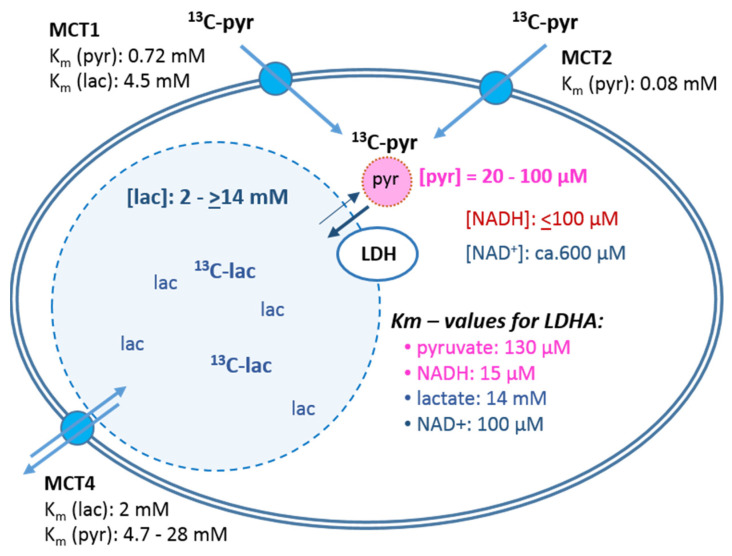
Figure 3.
Cellular parameters affecting the rate of pyruvate to lactate conversion. The scheme depicts cellular components for the uptake and conversion of pyruvate to lactate. Depicted is a cell with the intracellular spaces (shaded) representing the relative pool sizes of pyruvate and lactate (ratio approx. 1:50). Shown are intracellular concentrations of substrates and coenzymes from MCF-7 and MDA-MB-231 cells (Section 3.4) as well as KM-values reported for LDH activity by other sources [49,50]. The KM-values for the different monocarboxylate transporters (MCT) are as reported by [30,31,51,52,53].

